

Daily Forex Market Preview, 18/02/2016
The FOMC meeting minutes released yesterday was dovish but the markets did not react much. At the time of writing, the US Dollar remains muted for the most part with most of the currency pairs trading flat with little to no reaction. The bias remains mixed across the board as prices post a strong consolidation.
EURUSD Daily Analysis
(Click on image to enlarge)
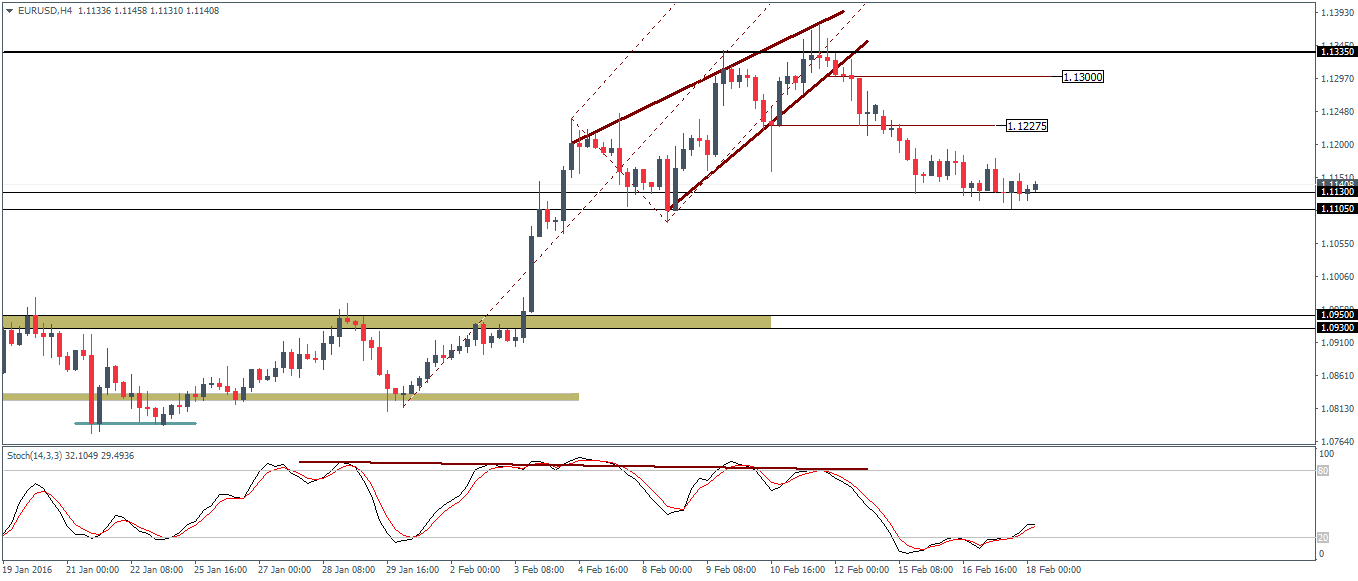
EURUSD (1.11): The Euro remains flat with the recent declines clearly showing signs of losing momentum. Price remains trading below the 1.12 resistance level but the previous two sessions have closed in a small bodied candlestick pattern with a relatively large range in comparison. Support at 1.113 remains intact with prices continuing to trade at this level over the past few sessions on the 4-hour chart which open the risk of a break below 1.11 - 1.113 support level. To the upside, 1.12275 is the first minor resistance level of interest which could see prices pull back to while a break below 1.1105 could signal a move to the next lower support at 1.095.
USDJPY Daily Analysis
(Click on image to enlarge)
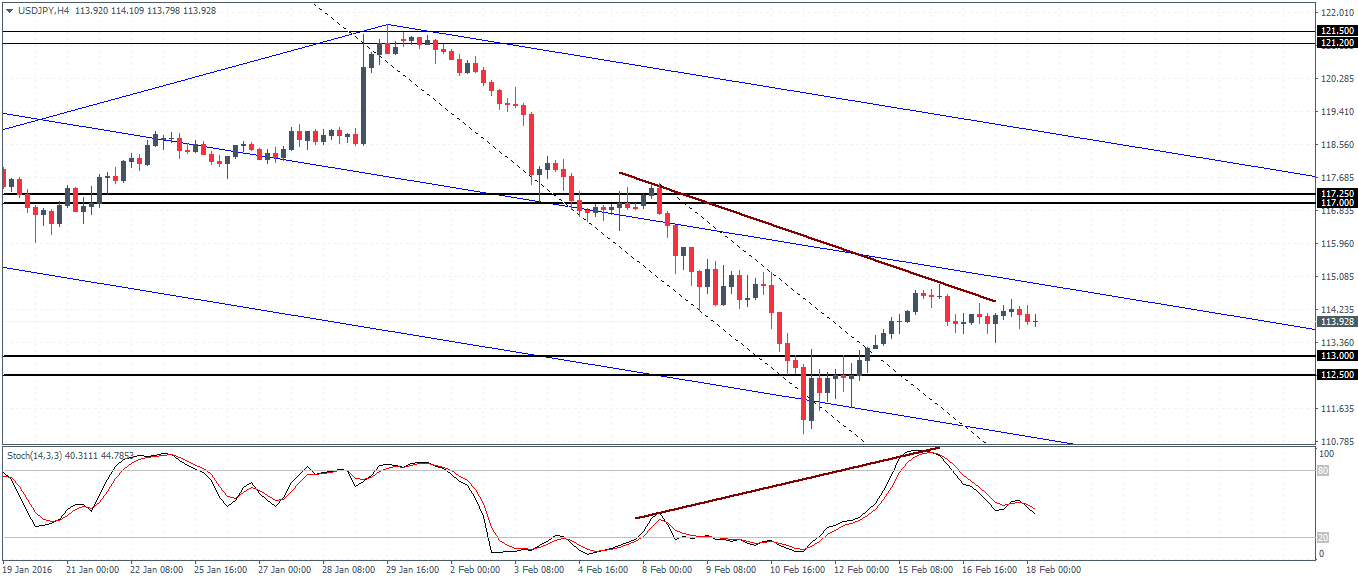
USDJPY (113.8): USDJPY closed in a doji candlestick pattern yesterday following a bearish close on the previous session. A move to the downside could signal further declines but needs to be confirmed only by a decline below yesterday's low of 113.377. Support at 113 comes into the picture with the hidden bearish divergence still in play. A break below 113 - 112.5 support could see USDJPY potentially test the previous lows but for the moment, it is likely that prices will stay flat above the 113 support.
GBPUSD Daily Analysis
(Click on image to enlarge)
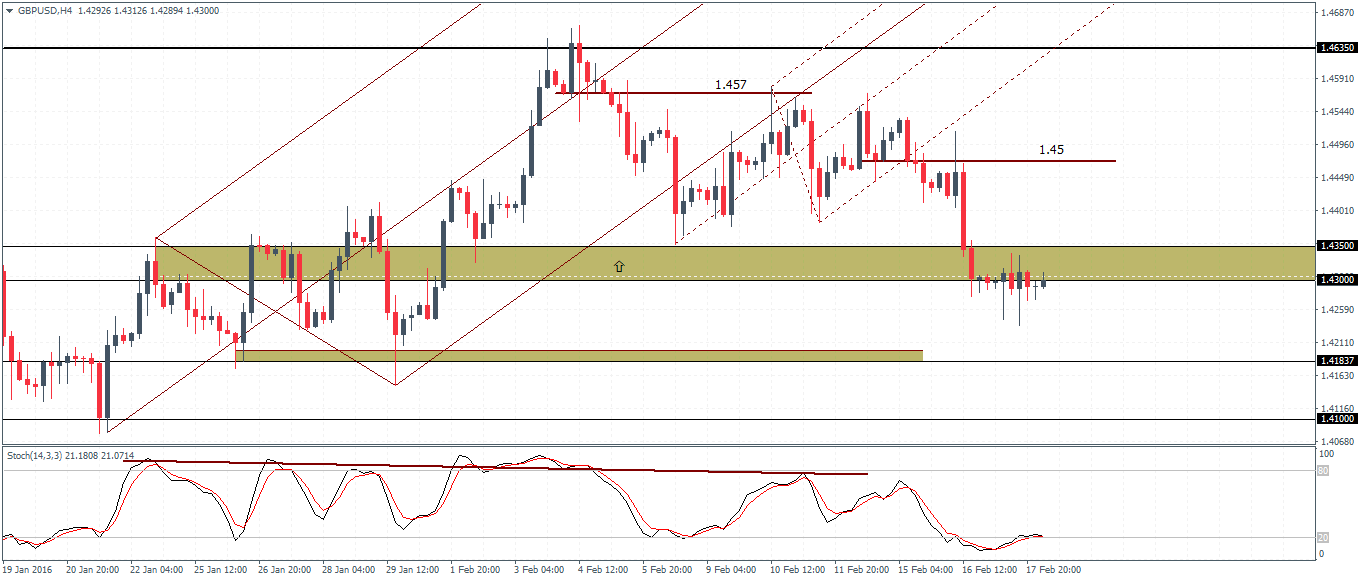
GBPUSD (1.42): GBPUSD formed a doji candlestick pattern yesterday above 1.42 support. A daily close above or below the doji high or low is needed for further price action to unfold. The bias remains flat for the moment with prices trading near 1.43 support. A close below this support on the 4-hour chart could see a decline to 1.42 while to the upside price needs to trade above 1.435 to target 1.45 and eventually 1.4635.
Gold Daily Analysis
(Click on image to enlarge)
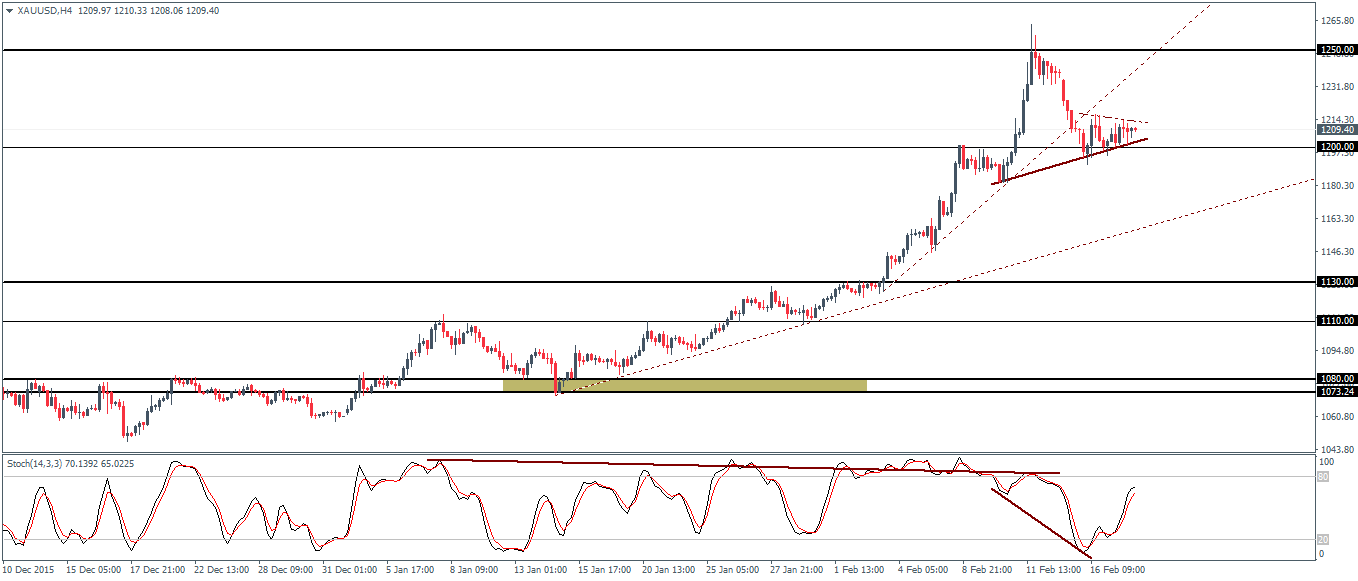
XAUUSD (1209): Gold prices formed an inside bar on the daily chart and could signal a potential breakout in either direction. The bias remains to the upside as prices are trading just above 1190 support. A break above the previous high of 1217 could signal a short-term correction to the upside as the 1200 support remains strong for now. On the 4-hour chart, prices are moving in a strong consolidation while there is scope for a downside breakout, any declines are likely to come only on a break below 1200 while a move to the upside could see the unfilled gap at 1238 acting as the likely level of resistance.



Comments
Log in or sign up to join the conversation.