

The running of the bulls in equities grabs headlines overnight with China up 2.5% leading the story. Perhaps the more important story is about the ground underneath as the weaker economic data from flash PMI reports seems at odds with the US growth story. Similarly, the US rate differentials clash with the weaker USD. Nevertheless, emerging markets are mixed as the all-clear signal on trade fears continues with CNY and the China charm offense winning in Asia but not elsewhere.
China stimulus talk to offset the US tariffs remains central to the suspension of disbelief about rates, growth or other stories. Those other stories are worth highlighting: 1) Brexit. The EU summit in Austria was inconclusive but with the leaders unanimously voting down the UK PM May’s “Chequers Deal.” The focus on French President Macron as a deal maker into October will be intense. 2) BOJ Noise. The BOJ cut its buying of bonds over 25-years today from Y60bn to Y50bn – and this led to a sharp jump in yields and steeper curve. Higher bond volatility is notable everywhere. 3) Credit. The WSJ article on junk bonds rising as a share of the overall market is worth considering given the sharp uptick in rates this week in the US. When you mix these stories together they clash with the present stampede of bullishness but they also explain the subtle turn of EM in EMEA down with Turkey and South Africa still under the kosh – giving back much of yesterday’s gains.
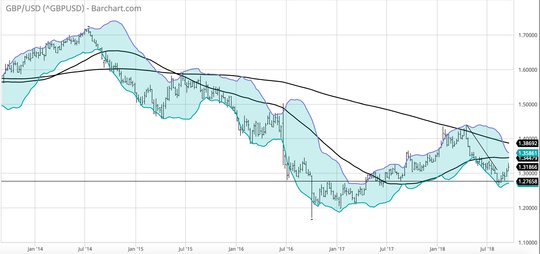
Markets are fickle and like any stampede the direction of which seems more serpentine than in a straight line. Witness the rise and fall of GBP this week in the G10. We may learn something from Brexit and trading headlines – namely that uncertainty hurts.
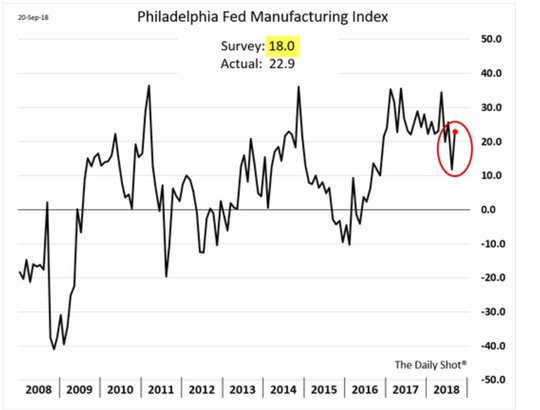
Question for the Day: Does growth matter? As markets enter the Friday witching session and face the FOMC next week, many are willing to take some money off the table and wait for the 3Q end. This seems logical but there is always the fear of missing out as the FOMO across the globe has been powerful. Momentum as a risk factor has explained much of the week’s trading and it adds to the passive vs. active management issues that plague all asset classes in 2018. The factor that seems to have lost out in the week is more about growth as the US outperformance hasn’t really been the story for the week – as the S&P500 is up 0.9% so far while the Stoxx Europe 600 is up 2.4% and that despite the PMI flash reports today and the US Philly Fed yesterday. Throw in that the price pressures everywhere and in the US particularly are moderating and you return to a Goldilocks environment – great growth without inflation fears. This isn’t the case in EM or most of Europe.
Explaining the difference matters as we close out the week and it maybe linked to the larger fears about confidence waning everywhere and the US mid-term elections. The SCOTUS issues that plague the Republicans won’t help at the polls. The budget fears are going to remain intense as well. The things that have put the USD at 10-week lows despite higher rates and better growth are where bears need to huddle or they better run early for hibernation. Perhaps it’s the old adage if its not growth then its value – where many see the US stock market as overvalued but that remains the October story for 3Q earnings and 4Q outlooks. The contrast of US confidence to EU and rest of world confidence is where the delta for future growth lives as it’s the capital investment, savings vs. spending base for planning.
What Happened?
- Japan August National core CPI 0.9% y/y after 0.8% y/y – as expected. The energy costs were up 7.4% y/y after 7.3% y/y while food-ex perishables was up 0.9% y/y after 0.8% y/y. The Core-Core CPI was up 0.4% y/y after 0.3% y/y – also as expected. The gain was mainly due to accommodations (+10.2% on year in August vs +1.9% in July).
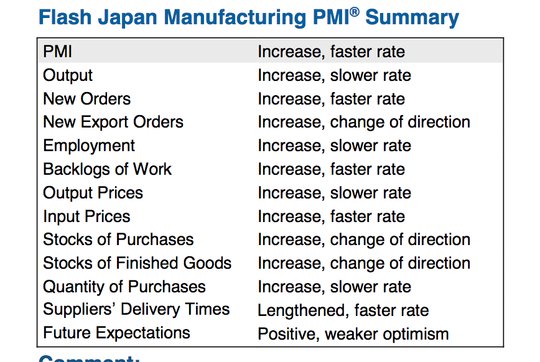
- Japan September flash Manufacturing PMI 52.9 from 52.5 – better than 52.4 expected – 3-month highs. Input costs are up rising at the fastest rate since Mar 2011. Future output index drops as geopolitics weigh.
- French 2Q GDP unrevised +0.2% q/q, 1.7% y/y – as expected. Household spending -0.1% after +0.2% q/q, Business Capital Investment +1.2% after 0.1% q/q, Foreign trade cut 0.2pp from GDP with exports revised to up 0.1% from 0.2% preliminary while imports revised to 0.7% from 1%. Inventories added 0.2pp to GDP.Overall domestic demand added 0.2pp to GDP.
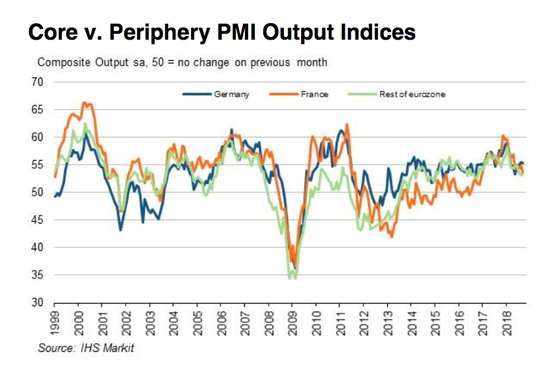
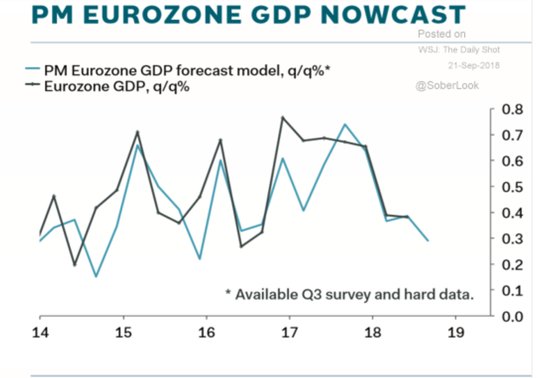
- Eurozone September flash Manufacturing PMI 53.3 from 54.6 – weaker than 54.4 expected – 2-year lows. The Services flash PMI 54.7 from 54.4 – better than 54.4 expected. This puts the flash Composite PMI at 54.2 from 54.5 – weaker than 54.4 expected – 4-month lows. The weaker export orders highlighted with over all orders at OCT 2016 lows.
- French flash Manufacturing PMI52.5 from 53.5 – weaker than 53.3 expected. The Services 54.3 from 55.4 – also weaker than 55.3 expected.The Composite 53.6 from 54.9 – weaker than 54.7 expected.
- German flash Manufacturing PMI 53.7 from 55.9 – weaker than 55.6 expected – lowest since April 2016. The Services 56.5 from 55 – stronger than 55 expected. The Composite 55.3 from 55.6 – weaker than 55.5 expected.
- UK August PSNB-ex Financials GBP6.753bn after GBP1.87bn in July and GBP4.345bn in August 2017 – more than GBP3.5bn expected. The August debt ex BOE is 75.2% of GDP down from 78.9% in Aug 2017. This was the first overshoot of the deficit since February. There was no one-off factor at play to explain the yearly overshoot, according to the ONS, who put the result down to weaker growth in receipts and higher EU budget contributions. August self-assessment receipts, off a strong July, were level with Aug 17, while taxes on production also fell on the year, with lower alcohol, tobacco receipts offsetting VAT. Corporate tax receipts have disappointed in 2018, although National Statistics officials saw "no economic story" in the GBP300 billion fall in August. The year to date, corporate tax receipts have matched the 2017 outturn of GBP25 billion, the weakest growth since 2013. Despite this, year-to-date borrowing held firm at a 16-year low, helped by about GBP1.0bn upgrade to the July 2018 surplus.
Market Recap:
Equities: The US S&P500 futures are up 0.1% after a 0.78% rally yesterday to new record highs. The Stoxx Europe 600 is up 0.4% trading at 3 week highs. The MSCI Asia Pacific rose 0.8% while the MSCI all-country world is up 0.4% - best in 7-months.
- Japan Nikkei up 0.82% to 23,869.93
- Korea Kospi up 0.68% to 2,339.17
- Hong Kong Hang Seng up 1.73% to 27.953.58
- China Shanghai Composite up 2.50% to 2,797.49
- Australia ASX up 0.45% to 6,305.40
- India NSE50 off 0.81% to 11,143.10
- UK FTSE so far up 1.05% to 7,445
- German DAX so far up 0.7% to 12,414
- French CAC40 so far up 0.75% to 5,493
- Italian FTSE so far up 0.8% to 21,563
Fixed Income: Japan and it’s Rinban surprise mixed with equity bid clash with weaker EU PMI flashes. UK Gilts reflect Brexit but not weaker budget – 10Y yields off 0.5bps to 1.577%, Bunds off 1bps to 0.56%, French OATs off 0.7bps to 0.778% while periphery choppy with Italy off 3.5bps to 2.84% - watching budget headlines – Spain off 1bps to 1.495%, Portugal up 0.5bps to 1.865% and Greece off 1bps to 4.02%.
- US Bonds are lower tracking Japan and equities – 2Y up 1.3bps to 2.817%, 3Y up 1.1bps to 2.904%, 5Y up 1.2bps to 2.965%, 10Y up 1.3bps to 3.074%, 30Y up 1.3bps to 3.208%.
- Japan JGBs sees bear curve steepening after BOJ cuts Rinban, equities extend rally –2Y off 0.8bps to -0.122%, 5Y up 0.1 to -0.066%, 10Y up 1bps to 0.12% and 30Y up 4bps to 0.885%. BOJ cut its 25+ year buying by Y10bn to Y50bn leading to steeper curve. The offer to cover ratios tell story – Y300bn of 1-3Y 2.69 from 3.10, Y 350bn of 3-5Y 2.43 from 3.92, Y180bn of 10-25Y 3.16 from 3.23 while Y50bn of 25+Y at 4.4 from 4.08.
- Australian bonds watching US and Japan bond moves balanced against S&P affirms AAA rating – 3Y off 2bps to 2.105%, 10Y flat at 2.70%.
- China PBOC skips open market operations, net drains CNY110bn on the day. For the week the central bank added a net CNY6bn via reverse repos and CNY265bn in MLF. Money market rates were lower with O/N off 0.25bps to 2.513% and 7-day off 0.5bps to 2.643%. The 10-year bond fell 1bps to 3.685%.
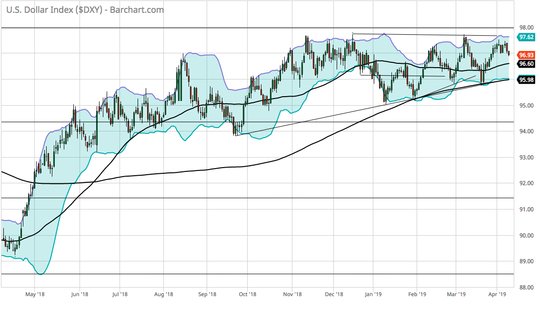
Foreign Exchange: The US dollar index is up 0.1% to 94.04 with focus on 92.50 and 95 with range 93.81-94.07. The USD was mixed in EM - In EMEA, USD is bid: ZAR off 0.6% to 12.377, RUB off 0.5% to 66.655, TRY off 1.3% to 6.280. In Asia USD was offered: TWD up 0.35% to 30.667, KRW up 0.4% to 1115.50, INR up 0.4% to 72.08
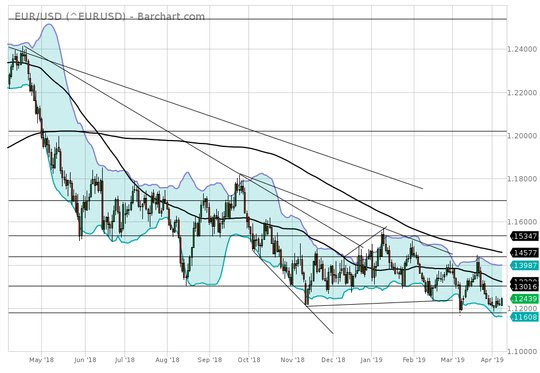
- EUR: 1.1770 off 0.1%. Range 1.1762-1.1803 with flash PMI drag and Brexit but 1.1720 base for 1.18 retest and 1.1880 target.
- JPY: 112.75 up 0.2%. Range 112.43-112.87 with EUR/JPY 132.65 up 0.15% - all about equities not rates with 112.40 base for 113.20-40 next
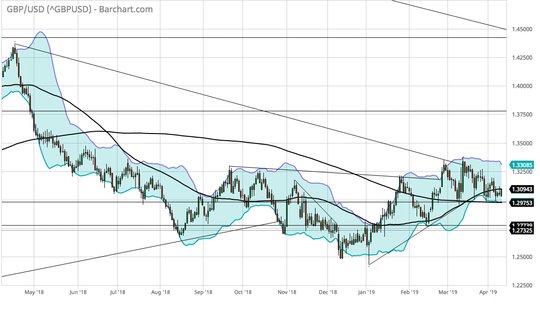
- GBP: 1.3190 off 0.55%. Range 1.3179-1.3266 with EUR/GBP up 0.5% to .8920 – so much for UK May and a quick Brexit deal – 1.33 cap means 1.3050 again.
- AUD: .7285 off 0.1%. Range .7281-.7304 with China driver capped by crosses – NZD .6690 up 0.1% with .6720 next key.
- CAD: 1.2910 up 0.1%. Range 1.2897-1.2919 with no obvious NAFTA deal its about data today and crosses with risk for 1.30 rather than 1.2880 breakout.
- CHF: .9565 off 0.25%. Range .9548-.9594 with EUR/CHF1.1255 off 0.35%.
- CNY: 6.8357 fixed 0.33% stronger from 6.8530. Trades better at 6.8345 from 6.8528 official close yesterday.
Commodities: Oil up, Gold down, Copper up 1.7% to $2.7810.
- Oil: $70.73 up 0.55%. Range. Trump rallying against OPEC worked yesterday but not today, weekend Algiers meeting key. WTI watching $75.46 Jan 2014 lows key upside target against $68 and $66.70 base. Brent $79.39 up 0.9% -watching $80.13 Sep 12 highs for $87 against $77.85 20-day ma.
- Gold: $1205.40 off 0.15%. Range $1205-$1209. Gold watching $1210.50 the 55-day fro break out potential with $1214.40 Aug 28 highs then $1225 with support at $1200 and $1183. Silver $14.35 up 0.2% - watching $14.36 the 20-day m.a. as base against $14.40 the Sep 3 lows as resistance for $14.75 target. Platinum flat at $835.60 and Palladium up 0.3% to $1055.60.
Conclusions: Does Wealth explain Confidence? While the focus on the US remains on the FOMC and jobs along with trade tariffs and mid-terms, the wealth effect of the US stock market rally and better economic growth has been notable. Household net worth—the value of all assets such as stocks and real estate minus liabilities like mortgages and credit-card debt—rose by nearly $2.2 trillion in the second quarter to a record $106.929 trillion.
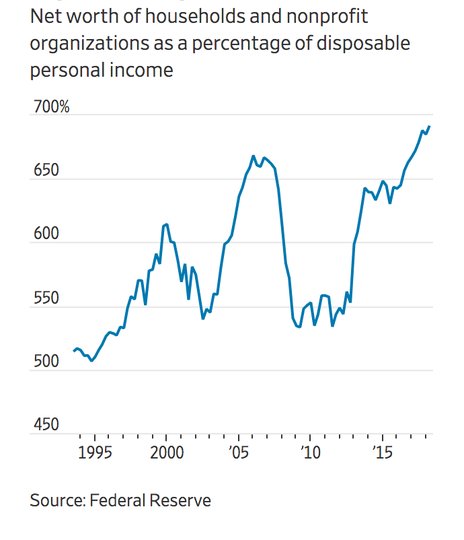
This isn’t all about housing either – as perhaps was the fear of 2007. The next bubble pop in the US will be somewhere else – probably with the US government debt leading – making the present 10-year yield at 3.07% matter should it break out over 3.5% and drive up the cost of government funding at the expense of the private sector. The value of owner-occupied housing climbed to more than $25 trillion in the second quarter, against roughly $10 trillion in mortgages. U.S. home prices rose 1.1% in the second quarter, according to the Federal Housing Finance Agency’s house-price index, and posted a 6.5% year-over-year gain.
Economic Calendar:
- 0830 am Canada Aug CPI (m/m) 0.5%p -0.1%e (y/y) 3%p 2.9%e / Core 1.6%p 1.5%e
- 0830 am Canada Aug retail sales (m/m) -0.2%p 0.4%e (y/y) 3.8%p 3.6%e
- 0945 am US Sep flash Manufacturing PMI 54.7p 55e/ Services 54.8p 55e/ Composite 54.7p 55e
Comments
Log in or sign up to join the conversation.