
With two new closing highs, last week and seven since May 10 current market conditions again justify the label "Smooth Sailing," for only the fifth time since October 2009. Sailors know storms follow calm like night follows day, but for now, hoist your sails while the wind is fair. Our market review tells the story with the help of some charts.
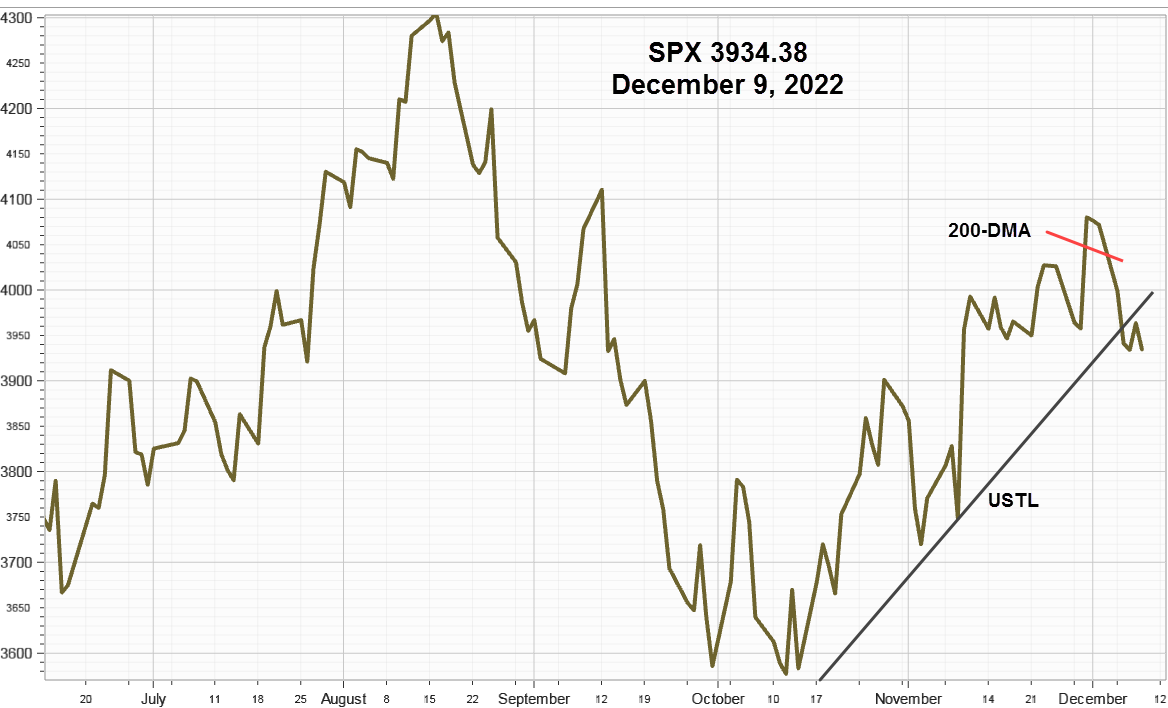
S&P 500 Index (SPX) 2439.07 advanced 23.25 points or +.96% making new closing highs both Thursday and Friday. On the downside, there is considerable support at 2400 and then 2378, at the blue 50-day moving average and the upward sloping trendline, USTL.

CBOE Volatility Index® (VIX) 9.75 declined .06 or -.61% for the week while the comparable IVolatility Implied Volatility Index mean, IVXM now 7.00 declined .18 or -2.51% to a 52 week low.


IVXM 7.00 at a 52-week low, call IV 6.84, put IV 7.15
VIX Futures Premium
The chart below shows as our calculation of Larry McMillan’s day-weighted average between the first and second months.
With 12 trading days until the June expiration, the day-weighted premium between June and July allocated 48% to June and 52% to July for a premium of 24.08%, well into the bullish green zone again this week.

The premium measures the amount that futures currently trade above or below the cash VIX, (contango or backwardation) until front month future converges with the VIX at expiration.
CBOE S&P 500 Skew Index (SKEW) 124.23 down 1.18 points or -.94% for the week. SKEW measures purchases of out-of-the-money S&P 500 Index puts that require a very large downside move to profit from long put positions.
An increase of this index indicates greater expectations for an extreme down move. The CBOE explains a Skew value of 100 means the perceived distribution of S&P 500 Index log-returns is normal so the probability of outlier returns is negligible. Calculated from SPX option prices it describes "tail risk." As Skew rises above 100, the left tail of the distribution acquires more weight increasing the probability of outlier returns.
The weekly average chart below shows SKEW has returned to levels early in the year when the markets were enthralled by the "Trump" trade.

The US Dollar Index (UUP ) & (DXY) 96.67 down .69 or -.71% for the week. With an activated two right shoulders Head & Shoulders Top pattern the downside measuring objective at 95 is marked in the right corner.

The declining dollar has been favoring technology and large capitalization stocks. Crude Oil Update
WTI Light Sweet Crude Oil (CL) 47.66 basis July futures declined 2.14 or -4.30% for the week. From a seasonal perspective, a premature high may have been reached before the May 25 OPEC meeting and it will now likely retest the 44 low made on May 5.

From the Disaggregated Commitments of Traders - Options and Futures Combined report as of May 30 "Managed Money," the group that best correlates with crude oil price changes and arguably the most important, decreased their net long position -2,646 contracts and decreased their shorts +15,606 for a net increase of +12,960 representing 7.27% of the of the open interest up from 6.72% last week.

Producers/Merchant/Processor/User (PMP) group often referred to as "Commercials" who had been adding more longs than shorts since April 25 reduced their longs -16,236 contracts and covered shorts +12,236 for a net decline of -4,188 or 6.52% of the open interest from 6.29% the previous week suggesting enthusiasm in hedging production at current prices.

Be the "House" and Win 85% of the Time
Today, investing in the stock market is a big gamble, almost like going to Vegas and playing the slots. And we all know what happens with slot machines -- the House always wins. It may take a loss occasionally, but the overall strategy assures that the House will always come out on top. Options lets you turn the table and be the house.
Currently, most sectors and indicators are bullish with a few diverging exceptions such as the SPDR Energy ETF (XLE), iShares Transportation Average ETF (IYT), the iShares Russell 2000 ETF (IWM ) along with our preferred breadth indicator the NYSE ratio adjusted Summation Index reported by McClellan Financial Publications. Without help from the energy sector, lagging breadth performance is understandable. In addition, technology and other companies in the major indexes with international business benefit as the dollar declines as measured by The US Dollar Index helping to explain the divergence with smaller domestic companies.
Summary
Market conditions remain bullish as the Federal Reserve prepares the markets for an interest rate hike at their upcoming June meeting although long rates have been declining as the yield curve flattens while the US Dollar Index declines. Unless derailed by an unforeseen geopolitical event or a larger than expected interest rate hike by the Fed there is a good chance "Smooth Sailing" conditions may last for the summer.
Comments
Log in or sign up to join the conversation.