

The market fell last week and snapped a 3-week win streak after the major indices danced around record highs. For much of the trading week, the market managed to go nowhere, until Friday's headline concerning China's decision to forgo a state visit to Montana. In fact, all the week's losses were largely contained to Friday, whereby the S&P 500 (SPX) fell roughly .50% on the day and for the week. Through much of Friday's quad-witching and options expiration activity, the market seemed to tread water, but then came the headline and the positive trade negotiations sentiment that had been building took another step back.

That step back may have been premature as a new report from the New York Times emerges saying, "The delegation of Chinese agriculture officials that had planned to travel to Montana and Nebraska in the coming week didn’t cancel the trip because of any new difficulty in the trade talks" according to sources, and "instead, the trip was canceled out of concern that it would turn into a media circus and give the misimpression that China was trying to meddle in American domestic politics."
As N.Y. Times additionally reports, both sides moved on Saturday to indicate that the negotiations continue, and points out that according to China’s state-run Xinhua news agency, fairly senior negotiators had “conducted constructive discussions” in Washington in recent days and had “agreed to continue to maintain communication.”
Aside from the late week headline, the Federal Reserve cut rates by 25 basis points, which matched expectations and was largely priced into the market. The major indices had a big move over the past few weeks and it is normal to see them pullback after flirting with resistance in our humble opinion.
All Things S&P 500
Going forward, it is important to analyze the “health” of any pullback to see if it is another normal and healthy pullback or something more severe and protracted. A normal and healthy pullback will bring the major indices back into support (their respective 50 DMA lines). If the 50 DMA line breaks, then that will indicate something more severe may unfold.

What we like seeing in the S&P 500 technicals is that the index finished above all moving averages. Moreover, it is considered a bullish sign when the 200-DMA is curling up. It signifies price movement has been in an uptrend for a relatively extended period of time. For now, the bulls deserve the benefit of the doubt, as long as the market stays above support. A retest of the 50-DMA is highly probable near-term, given some seasonal factors, historical data and the fact that general market sentiment has become overtly bullish.

Sentiment indicators are generally, but not always, reasonable contrarian indicators. To be sure, investor sentiment is a tricky business. And trying to trade on a contrary basis is fraught with risk (remember, everybody, can't be a contrarian). Despite what may be perceived to be sentiment and seasonal headwinds, market breadth still improved for the week. Recall from last week's Research Report my focus on the BPISPX or S&P 500 Bullish Percent Index. Here is what I offered:

"The chart above is the S&P 500 Bullish Percentage Index or BPI. The index has been rising over the last 3 weeks, as we would expect with the S&P 500 rising in kind. This particular breadth indicator suggests there’s still at least another 8 percentage points to go before a higher probability of a pullback is presented."
Breadth improved a bit more this past week, but it's definitely the rate-of-change that might be signaling the market lacks the ability to continue with the September rally. The BPI rose less than 1 percentage point (67.80 to 68.20) on the week, as shown in the chart below:

Although breadth improved, it was quite irrelevant. Additionally, when I look at the percentage of S&P 500 stocks trading above their 200-DMA, that also improved on the week, but may have hit a resistance level as well. Recall from last week's Research Report once again the following:
"At present, the percentage of stocks trading above their 200-DMA is roughly 75 percent. Unfortunately, as we can also see in the chart, each of the last 2 times we’ve hit the 75% level, the market has pulled lower. Does this mean the same breadth level will present another pullback? According to this particular market breadth indicator it says we are in the area where we should start to expect a near-term pullback, but…"

The market internal trend held true to form. As the number of stocks trading above the 200-DMA moved above 75% this past trading week, Friday the percentage dipped right back below. This does not suggest all is lost for the remainder of the year in the market or that investors/traders should turn bearish; it simply means the market has a higher probability of retesting support levels near-term. The bigger, long-term bullish trend in the S&P 500 remains in-tact and suggests that investors should maintain a "buy the dip" mentality.

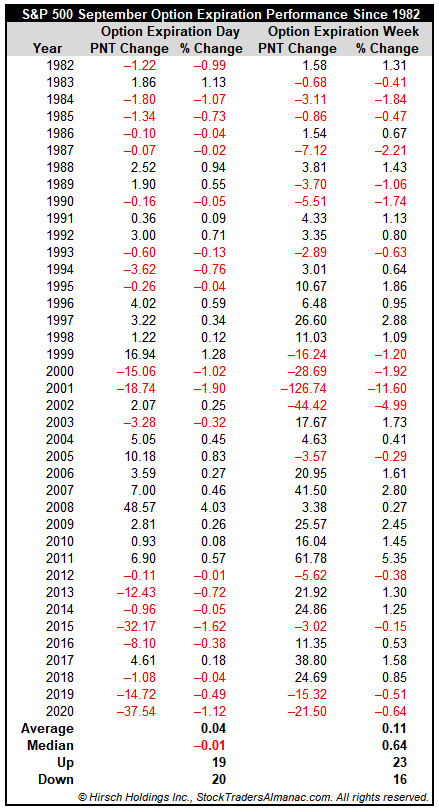
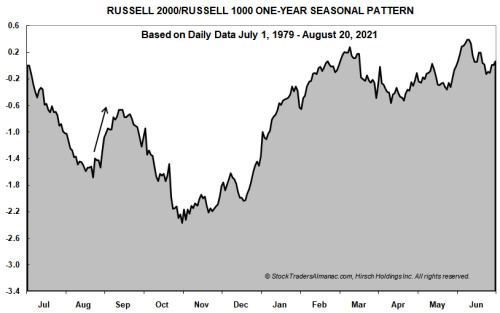
The coming week is an important week for various reasons. Seasonal factors, as well as portfolio management factors, come into play this coming week. According to historical calendars, we may need to be on high guard for the second half of September, suggests LPL Financial and with regards to the following seasonal chart.
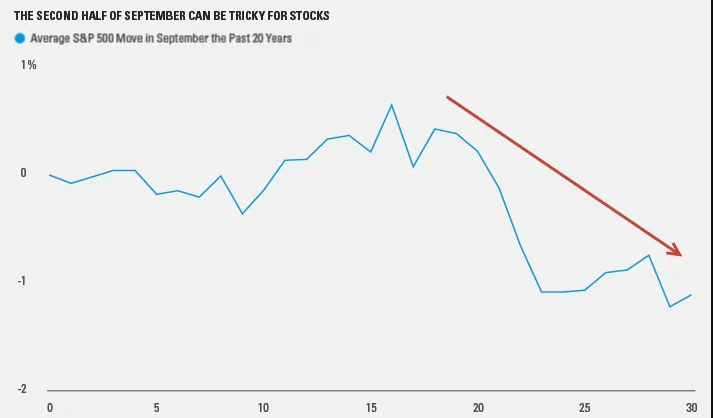
As shown in the LPL Chart, The Second Half of September Can Be Tricky For Stocks; later in the month of September is when we’ve seen seasonal weakness. The market has performed quite well in the face of some troubling headlines, but the calendar could be one of the biggest near-term risks to investors and traders alike. Not for nothing, but with all the trade-headline and Brexit drama thrown about in 2019, if it's just a seasonality issue, that's likely one that investors would welcome.
Moreover, the final week of September is also the final week of the quarter, which suggests portfolio rebalancing ahead. This is denoted in recent notes from Nomura, as follows:
- Buyback black-out starts to kick in next week, and increasing over the next 3 weeks.
- month-end rebalancing should see significant equity selling next week, probably culminating Wednesday or Thursday.
- HFs have been re-grossing lately; gross now at 18 month high.
- the large gamma long in the dealer community (mainly the 3000 strike) expires today, which on balance, means that any flow will have larger market impact next week then it would have had this week.
- On Monday we have 6 trading days left for the month (and the quarter). That is normally when the month-end rebalancing flows kick in. We have not yet seen any qualified sell-side estimates on size, but this month should have the potential to be a big month for equity selling, given asset class performance MTD.
- In August we saw a rally in the last 5 days of the month.
The good news for market participants is that the Fed has now eased financial conditions in the last two consecutive FOMC meetings and Fed considerations will also take a backseat over the next 30-60 days. With that, investors will likely look forward to the upcoming earnings season. It's no secret as to what has taken place in the way of a rising S&P 500, both YTD and over the last 12 months. Keep in mind, the YTD gains are far greater than what has taken place of the last 12-month period, as identified in the chart below from Bespoke Investment Group:

The chart kind of puts things into perspective, even level sets our understanding as to what 12 months vs. 9 months does to our trader psyche. Nonetheless, that is not the main point we'd like to make at this juncture and with the previous reference to the upcoming earnings season. The main point I'd like to hammer home is that the vast majority of the S&P 500's rise over the aforementioned periods has come by way of price-to-earnings multiple expansion (PE). Ciovocco Capital offers the following technical analysis and charts in their latest YouTube video discussion on the subject of PE expansion.

The chart identifies that 8 of the last 9 months found the S&P 500 rising as earnings have been mostly flat on a YoY basis. Such like-PE expansion has happened 11 times in the past... AND RESULTED IN STRONG MARKET GAINS IN THE SUBSEQUENT 3-YEAR PERIOD! Again, the table below from Ciovacco Capital points to the previous periods of PE expansion.

Using analogues such as the one offered regarding the S&P 500's performance after 8 of 9 months of expressing PE expansion, I cannot suggest history will once again repeat itself. I cannot suggest it won't either. Analogues give us a good deal to consider in the way of probabilities, which is far more reliable than possibilities. Analogues beg of investors to keep an open mind about the long-term, even as the near-term market moves may prove disorderly and chaotic. And yes, there are global issues that bring about such chaos in the markets, seemingly on a weekly basis, but as long as the Global Dow is above the 2007 peak, it is tough to be overly bearish. In fact, this looks quite healthy and bullish overall.

For the coming week, seasonality looms large and with market implied volatility moving higher in the prior trading week. With the VIX up some 11% last week, mostly confined to a significant climb on Friday, the weekly expected move for the S&P 500 has also risen for the coming week. The weekly expected move has jumped from $40/points last week to $47/points in the coming week.

The VIX was dormant for much of the week, dropping below 14 even on Friday and before the headlines. But probably more depicting trader concerns has been the Volatility of Volatility (VVIX) Index. It simply hasn't gotten back to its previous lows from July, even with the S&P 500 breaking out of the August-sideways action, to the upside.

Traders are clearly still concerned about global trade, fears of a recession in the next 6-12 months and the specter of the inverted yield curve. While these fears linger and VVIX remains elevated, I ask investors to remind themselves that, when it is deemed necessary, the market will dictate policy changes. Moreover, do not overlook the long-term bullish technical and market internals that suggest the S&P 500 will capture new highs over the next 12 months at least.
Economic Data/Fed Cuts
So the Fed cut rates again and something unusual took place. The market was actually higher on a Fed-day led by Jerome Powell. Additionally, certain aspects of the latest press conference were not set up for such a market response. Within the statement from the FOMC, 1 additional dissent occurred at the latest policy meeting. The dissent addition was from St. Louis Fed President James Bullard. He wanted a more aggressive half-point cut due to signs the economy is slowing down.
"A half-point cut would have been a more appropriate action given “signs that the U.S. economic growth is expected to slow in the near horizon.
Trade policy uncertainty remains elevated, U.S. manufacturing already appears in recession and many estimates of recession probabilities have risen from low to moderate levels.
A half-point rate cut would have provided insurance against slow economic growth and help move inflation back up to 2%."
In addition to the increased dissent, the dot plot also didn't show a forecast for another rate cut. Taken together, one could argue the market would perceive the latest rate cut as a hawkish cut, but still the market closed higher on the day.

As you can see from the Fed’s dot plot above, the median estimate sees no cuts for the rest of the year and next year and then a hike in 2021. You probably shouldn’t take 2021 policy estimates very seriously since the Fed didn’t guide for any cuts this year back in June. Also, in the presser, Powell essentially stated he’s going meeting by meeting and if the data changes, the policy will change. There’s not much visibility into December 2019 let alone 2021. To be clear, the CME Group FedWatch tool shows there is a 49.2% chance of a cut by the end of this year.
With an additional dissenting vote and no additional rate cuts forecasted near-term, Jerome Powell did hint that if economic conditions worsened, the Fed may need to expand its balance sheet sooner than it had anticipated.

But Barry Bannister, chief equity strategist at Stifel suggests that unless the Fed does cut more, the S&P 500 remains at risk.

"Fed funds minus the neutral rate shows the S&P 500 remains at risk. Peaks in fed funds minus the neutral rate have marked every equity bear market since the late 1990s.”
- Stifel looked at the 50-day moving average of the 10-year/3-month spread. Going back to 1969, an inversion of the average preceded the start of a recession by 10.4 months with a median lead time of 10.7 months.
- The 50-day average moved into an inversion on June 20, which would imply a recession around May 2020, Bannister wrote, noting that the S&P 500 tends to lead recessions by around six to seven months. If that holds up, the risk to the S&P 500 is in the fourth quarter of this year, he said.
- Bannister said low real interest rates support an S&P 500 trailing 12-month price-to-earnings ratio of 19 and fair value of 3,021 in 2019. But factoring in a 38% chance of recession, as calculated according to the New York Fed’s yield-curve model) brings fair value down to 2,900, he said, around 3.5% below the index’s Wednesday close.
Besides this finer point on the efficacy of the Fed, at the very least, the FOMC has collectively given themselves some time to align with markets over the next 60 days or so. And while we've been highly critical of Fed chairman Jerome Powell in the past, we would suggest he performed rather well at the latest press conference. In fact, Fed Watcher Tim Duy showed some favor toward Powell in this same regard.

"Also hearing commentary that Powell isn’t a good communicator, and not just from President Trump. So on this point, sure, Powell’s conversational, off-the-cuff style hasn’t always been the best for the job. We, including myself, will tend to read too much into errant remarks, largely because we all worry that we are on the wrong side of the call and no one likes to be on the wrong side of the call. That said, I think a fair comparison of this week’s press conference with the last reveals that Powell is modifying his approach. This week he appeared to anticipate questions much better than in the past and not start some story like “mid-cycle adjustment” that forced him to back up over himself and then turn back around. It was a clean, solid performance.
But what we tend to care most about, as investors, is how the market performs during an easing cycle and based on how much easing is being executed by the FOMC. Markets tend to rally after rate cuts because those policy actions translate into lower borrowing costs for individuals and corporations and tend to support higher moves for risk assets.
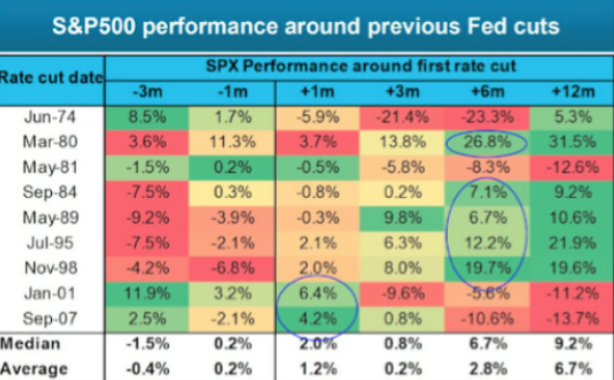
Since 1990, the S&P 500 has gained on average 0.16% on the day of a 25-basis-point cut. One month later, the broad-market benchmark is 0.57% higher. Double that cut and the market is 0.34% higher on the of the decision day and 1.25% higher a month later.
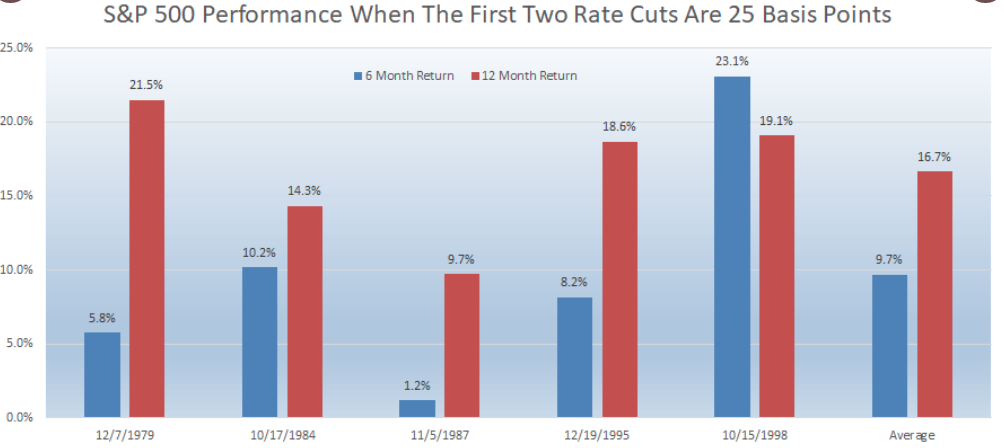
We want to also look at specific rate cut cycles. One month later after, a pair of rate cuts, the S&P 500 tends to be up 1.56% on average and 1.74% during successive cuts. The market has climbed in three of the past five periods in which the Fed cut rates twice (see table below).

Steven G. DeSanctis, an equity strategist at Jefferies, said not all rate cuts are created equal.
“Although history does not repeat itself, sometimes it does rhyme. Having reviewed performance after a second and even third rate cut, we think performance should be good from here, with small-caps leading. Growth tends to lead early after a second and third cut, but value comes back over the last six months and wins for the full year,” he said in a note last week.
After all this talk about the Fed and probabilities of market performance, I can't help but move on to a broader discussion concerning the economy and economic data. We noted in the prior week that the Citi Economic Surprise Index had found its way into positive territory recently. This week, it continued to surge after a slew of better than expected economic data, mostly surrounding the housing sector.

I want to make a finer point about the Citi Index, however. The Citi Economic Surprise Index is littered with lagging economic data, making it an inconsistent investment tool. Simply by looking at the chart positioned above, the index had been in negative territory since September of 2018, yet, the market has achieved new highs since that date. As such, we can clearly validate that it is less an investment tool than it is a greater tool for representing the lagging economic data surprises. And why do we say lagging? “X” marks the data that is old-news or backward-looking.
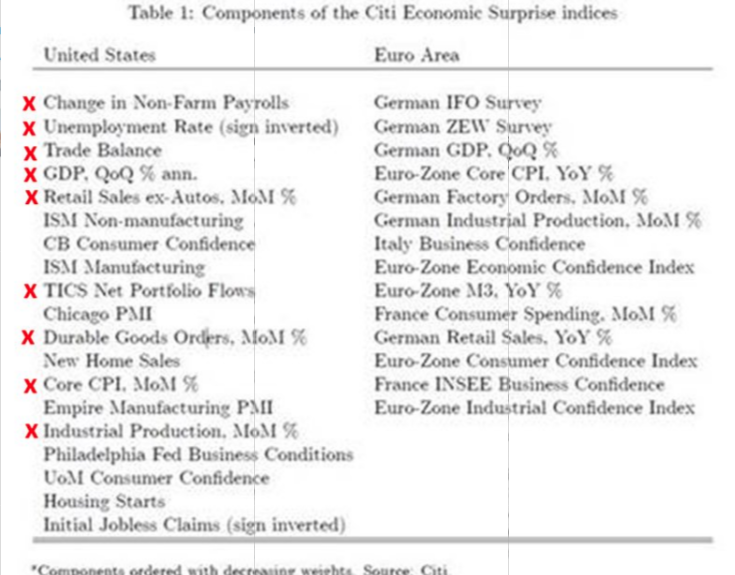
Nonetheless, positive surprises in data are important, but more so when they come from leading economic data, rather than lagging data. Unfortunately, even when we look at the leading economic data points within the Citi Economic Surprise Index, it doesn't fit with the turn-of-the-century economy. Much of the leading data relates to manufacturing, regional or otherwise. We understand that manufacturing, as a percentage of real GDP, is only around 11-12% and has been declining since the 1970s. The United States is increasingly a service sector driven economy, with more than 70% of GDP coming directly from consumer spending. It's just one of the reasons investors falsely assume that manufacturing is a harbinger of a recession.
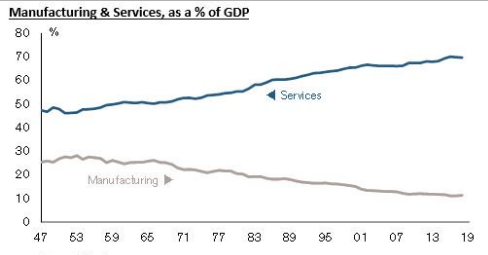
Moreover, it is also important to understand that as investors/traders we recognize that ISM Manufacturing data is more correlated with equity prices. It is soft data, not hard data. Soft data is sentiment-driven data, surveys. We prefer hard data and the hard data is improving.

Furthermore, the ISM manufacturing survey doesn't even ask its survey respondents about growth in relation to last year, but if things are better/worse/the same over the month, MoM.
I don't desire to suggest the Citi Economic Surprise Index lacks value... but it's not something that guides my investing and trading decisions. With that being said, I'd expect the Index to continue to march higher near-term based on the leading index components related to housing data. New Home sales and Housing Starts are both leading components in the Index.
The housing sector data released ahead of the FOMC rate announcement Wednesday proved to come in ahead of economists’ expectations. Total housing starts in August were above expectations, and starts for June and July were revised up combined. This was the highest level of starts in 12 years. The housing starts report showed starts were up 12.3% in August compared to July, and starts were up 6.6% year-over-year compared to August 2018.
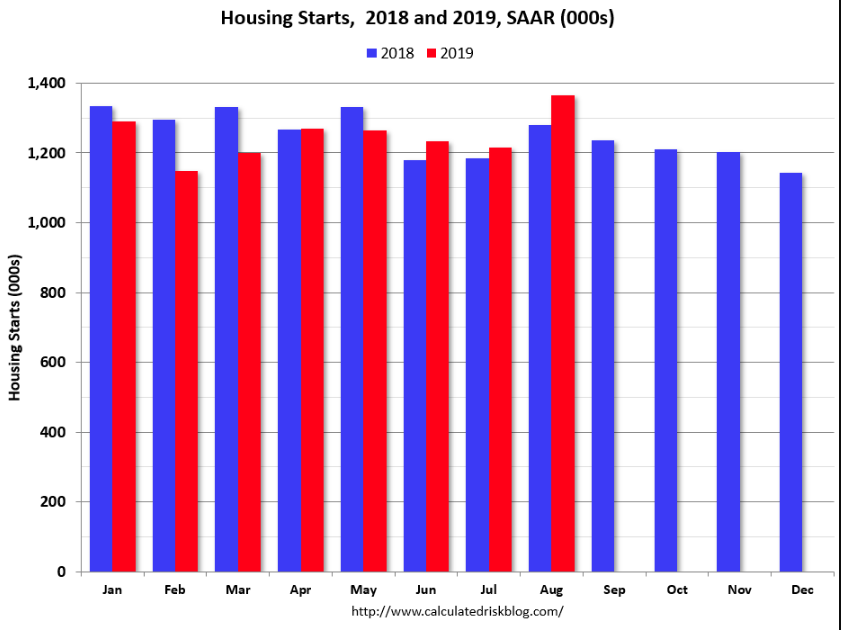
In addition to the strength in Housing Starts, which assumes growth in New Home sales ahead, Existing Home sales were also quite strong last month. Existing home sales were up 2.6% year-over-year (YoY) in August. This was the second consecutive YoY increase, following 16 consecutive months with a YoY decrease in sales. Inventory is still low, and was down 2.6% year-over-year (YoY) in August.

The Existing Home sales comparisons will get easier towards the end of this year, and with lower mortgage rates, sales might even finish the year unchanged or even up from 2018, according to Bill McBride.
It may have seemed a side note that the Philly Fed Manufacturing Index fell in the latest reading, but this was largely expected after the sharp uptick. The Philadelphia Federal Reserve’s manufacturing index fell to 12.0 in September after registering a reading of 16.8 in August. Economists polled by MarketWatch expected a reading of 10.0.
The indexes for general activity and new orders fell, while the indexes for shipments and employment increased, the Philly Fed said, but it was just a slight decline for the gauge for new orders, from 25.8 in August to 24.8 in September.

The diffusion index for future general activity fell 12 points to 20.8 (see Chart 1). Over 37% of the firms expect increases in activity over the next six months, while 16% expect declines. The future new orders index decreased 9 points, and the future shipments index decreased 2 points. The firms remained optimistic about future hiring, and the future employment index increased 6 points. The firms also expect prices to move higher in the next six months: The future prices paid index increased 10 points, and the future prices received index increased 9 points.
As most of the economic releases pertaining to manufacturing, the Philly Fed Index is also soft data, surveys and not much more than that. For the week ahead, the economic data calendar is a bit heavier and kicks-off Monday with Market manufacturing and services PMI.

The more impactful economic data releases remain with Consumer Confidence, Pending Home sales, Weekly Jobless Claims, Durable Goods and PCE to round out the week. Given the recent string of positive economic data surprises and the surge in the S&P 500 through much of September,
Earnings Outlook
The good news remains that despite the widely anticipated, heralded and forecasted earnings recession, one has yet to arrive on a GAAP basis. Unfortunately, that which is distributed widely by the financial media is based on FactSet forecasted Non-GAAP earnings. With this in mind, there has been a slight EPS decline (-1%) through the first half of 2019. For the Q3 earnings season, the coming week has 9 S&P 500 members on deck to report results, including Nike (NKE), ConAgra (CAG), Micron (MU) and others.
FactSet offers their latest forecast for Q3 2019 EPS as follows:
- The estimated earnings decline for the S&P 500 is -3.8%. If -3.8% is the actual decline for the quarter, it will mark the first time the index has reported three straight quarters of year-over-year earnings declines since Q4 2015 through Q2 2016.
- The forward 12-month P/E ratio for the S&P 500 is 17.0. This P/E ratio is above the 5-year average (16.6) and above the 10-year average (14.8).
- The estimated (year-over-year) revenue growth rate for Q3 2019 is 2.8%, which is below the 5-year average revenue growth rate of 3.5%. If 2.8% is the actual growth rate for the quarter, it will mark the lowest revenue growth rate for the index since Q3 2016 (2.7%). Eight sectors are projected to report year-over-year growth in revenues, led by the Health Care sector. Three sectors are predicted to report a year-over-year decline in revenues, led by the Materials sector.
- For Q4 2019, analysts are projecting earnings growth of 3.0% and revenue growth of 3.6%.
- For CY 2019, analysts are projecting earnings growth of 1.3% and revenue growth of 4.1%.
- For Q1 2020, analysts are projecting earnings growth of 7.9% and revenue growth of 5.4%.
- For Q2 2020, analysts are projecting earnings growth of 9.0% and revenue growth of 6.3%.
- For CY 2020, analysts are projecting earnings growth of 10.6% and revenue growth of 5.6%.
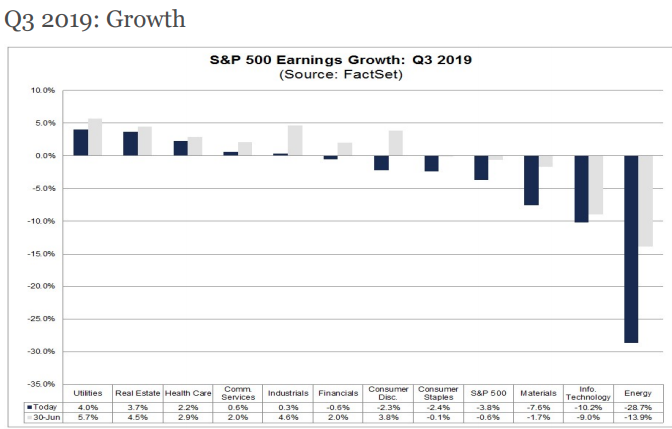
According to FactSet's earnings transcripts tracking, the Energy sector has recorded the largest decrease in expected earnings growth since the start of the quarter (to-28.7% from -13.9%). This sector has also witnessed the largest decrease in the price of all eleven sectors since June 30 at -4.1%. Overall, 25 of the 28 companies (89%) in the Energy sector have seen a decrease in their mean EPS estimate during this time. Of these 25 companies, 16 have recorded a decrease in their mean EPS estimate of more than 10%, led by Noble Energy (to -$0.07 from $0.01), Hess Corporation (to -$0.21 from -$0.04), and Apache Corporation (to -$0.08 from $0.20). However, Exxon Mobil (to $0.90 from $1.15), Chevron (to $1.82 from $2.10), and Occidental Petroleum (to $0.56 from $1.00) have been the largest contributors to the decline in expected earnings for this sector since the start of the quarter. The stock prices of all three companies have decreased since June 30.
It's at this point, and before we take a look at Refinitv's Q3 2019 EPS forecast, that I remind readers of what the market is and does. The market is a forward-looking pricing mechanism in that it projects EPS, through the relative movement of the S&P 500. It usually projects out to 6 months. With this point of fact, I reflect that if EPS has declined in 2019, the last 9-month rally in the S&P 500 is a product of PE expansion.
As previously noted from FactSet, the last time the S&P 500 EPS declined for at least 3 consecutive quarters was in 2015-2016. The following data identifies the EPS decline from these quarters:

It's painfully clear (dividend-adjusted) that the EPS declines from that period were far worse than the current period. From 2015 through mid-2016, the S&P 500 was range-bound, until it broke out in July. Much luck the 2018-2019 range-bound action, that also broke out in July. (Chart 2015-2016 SPX)
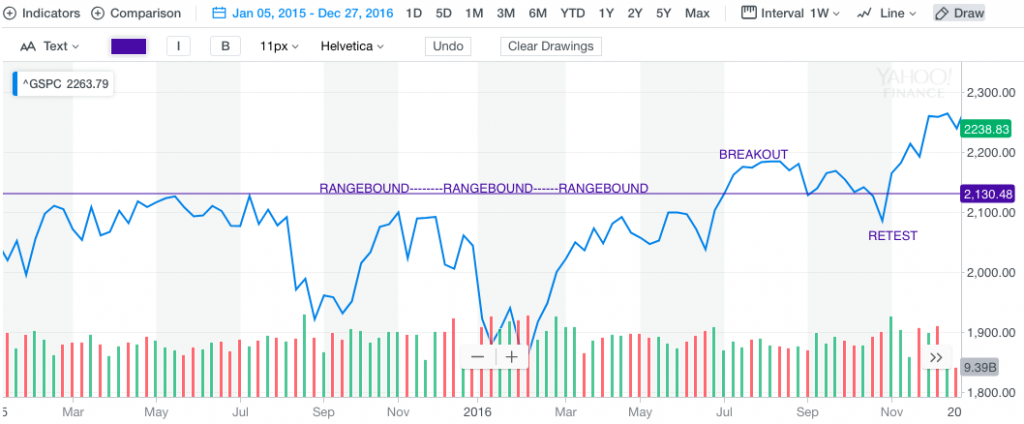
The market, in mid-2016, was pricing in better earnings over the next 6-month period. By the way, that is exactly what the market received, better earnings.

At no point in 2016 was a bear market produced, although market volatility was amplified. At no point in 2015-2016 was a recession achieved, although growth was below trend. In 2016 the ISM Manufacturing Index also dipped into contraction territory, as it has in 2019. But most importantly, the earnings recession of 2019 is far less severe than it was in 2015-2016 and in both periods the S&P 500 maintained a long-term bullish trend, in part, due to PE expansion. It is with the earnings recession analogue of 2015-2016 that I assert, the market has been rangebound, making slight new highs, but not found with a clear breakout due to clarity on EPS in the coming quarters. Once the banking sector kicks-off earnings season and delivers updates on FY19 guidance, I am of the opinion the market will either breakout, with even greater PE expansion, or wade through a retest of the 200-DMA.
Now, with a look backward having been completed we can also look forward and with respect to Refinitiv's Q3 2019 EPS forecast. Here is what the firm has to say:
19Q3 Earnings Growth Highlights
- The estimated earnings growth rate for the S&P 500 for 19Q3 is -2.2%. If the energy sector is excluded, the growth rate improves to -0.4%. The S&P 500 expects to see share-weighted earnings of $341.2B in 19Q3, compared to share-weighted earnings of $348.9B (based on the year-ago earnings of the current 505 constituents) in 18Q3.
- Six of the 11 sectors in the index expect to see an improvement in earnings relative to 18Q3. The financials and real estate sectors have the highest earnings growth rates for the quarter, while the energy sector has the weakest anticipated growth compared to 18Q3.
Investor Takeaways
For the time being, the market is expressing overbought and somewhat exhausted conditions along with many technical and breadth indicators. Sentiment has also become overly bullish according to certain weekly surveys and metrics we follow. One of those metrics is the Equity Put/Call ratio.

As you can see, the Equity Put/Call ratio dropped from an excessively bearish reading in August to an excessively bullish one right now. I've highlighted all similar readings in 2019. Take notice that the initial two readings (blue lines) DID NOT lead to big bearish reversals and S&P500 continued to march higher (dips were bought). However, the next 2 readings (red lines) DID lead to fairly significant corrections in May and August. It remains to be seen as to what will happen this time around and with the Equity Put/Call basing and turning upward. .
Now let's step back in time through the way-back machine and table below from LPL Financial:

Recall the December 2018 low and all the calls for retesting that low since. History states that the S&P 500 gains +22.1% on average when it doesn't close beneath the December lows during the following Q1 period. And when it doesn't close beneath that low it is up for the year 34 out of 34 times. Up only +3.1% when it closes beneath the Dec low in case you were curious. Given that in Q1 2019 the S&P 500 didn't close beneath the 12/24/18 lows, will this year mark 35 for 35? Pretty high probabilities right? And while seasonality doesn't bode well for the market this coming week, October has historically been a good month for the markets.
In the past 10 years in fact, October has been the 3rd strongest month of the year for equities. Presently, however, recency bias looms large amongst investors as the market and certain commodities (oil) began the year-end decent in the month of October last year.
While the most recent history (2018) hasn't been kind to investors in October, over the last 10 years it has, but markets tend to carry more volatility in the month of October. Stock volatility has been 25% higher in October on average ever since 1928, according to Goldman equity derivatives strategist John Marshall. Big price swings have been seen in each major stock benchmark and sector in October over the past 30 years, with technology and health care being the most volatile groups, Goldman said.
Regardless of trends, seasonality and the geopolitical issues that remain unresolved, Ed Yardeni is of the opinion the market will rise some 17% through the next 12 months.

"I’ve got 3,500 as my target for next year. We’ll get there on higher earnings with maybe somewhat higher valuation as the perception continues to be that interest rates aren’t going up much, if at all.”
Yardeni builds his bullish case on the notion that Washington and Beijing agree to a trade war deal, a strong U.S. jobs market that’ll keep consumers spending and a global economy on the mend due to easy central bank policies. The positive developments will create momentum for growth stocks through 2020, according to Yardeni. He doubts value, which recently got a bid higher, will outperform in the coming months.
In closing out this week's Research Report, while the bears are busily tweeting about the issues surrounding the ISM Manufacturing Index, the trade war "wills and wonts" and the latest Fed repo operation, S&P 500 companies are are still driving sales and earnings, even if the rate-of-change produces a slight earnings recession in 2019 that proves a low bar in 2020. The Fed is now at the wheel and addressing that which may pose a threat to the expansion cycle with easier financial conditions.
Comments
Log in or sign up to join the conversation.