

Although September has lived up to the historical script as being a weak month for stock prices, the mood on Wall Street appears to be improving a bit to start the week. From my seat, the more upbeat view on the stock market can be tied directly to the idea that a stimulus deal from D.C. is back on the table. And while the Democratic bill still has a higher price tag than the GOP would like, the fact that the two sides are at least talking again is seen as a positive. So, my take is that as long as more stimulus remains on the table, the downside from the current corrective phase may be limited from here. Whether or not the bulls can get anything more than a "defensive stop" and some movement up into the middle of the trading range remains a question that will likely be tied to the economic outlook. But for now, with our Primary Cycle models still green, my thinking is we should continue to give the bulls the benefit of any doubt and be looking to buy any dips going forward.
The Big-Picture Market Models
There are no changes to the Primary Cycle board again this week. As I wrote last week, given that the board is currently green across the board, I believe we should continue to stay seated on the bull bandwagon. And with a stimulus package back on the table my thought is traders will be looking to put dry powder to work.
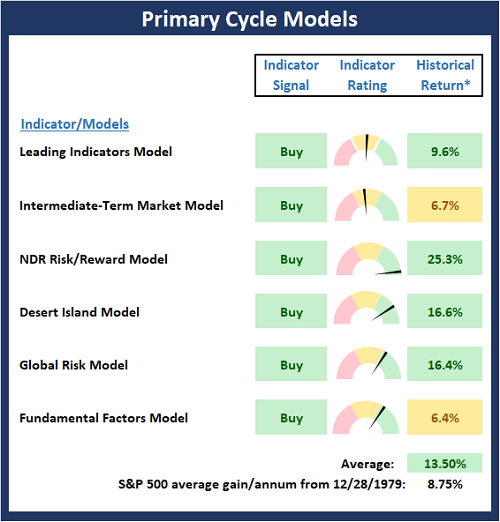
* Source: Ned Davis Research (NDR) as of the date of publication. Historical returns are hypothetical average annual performances calculated by NDR. Past performances do not guarantee future results or profitability - NOT INDIVIDUAL INVESTMENT ADVICE.
Checking In On The "Primary" Cycles
While I don't often make portfolio adjustments based on the long-term trends in the stock market (aka the "primary cycles"), I have found over the years that checking in on state of the cycles and the weekly/monthly charts helps to keep the big-picture in perspective.
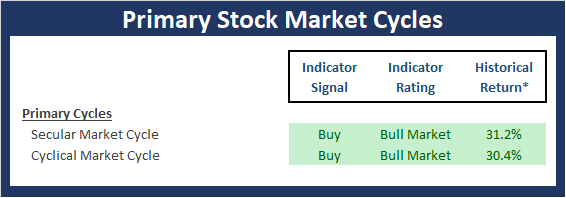
* Source: Ned Davis Research (NDR) as of the date of publication. Historical returns are hypothetical average annual performances calculated by NDR. Past performances do not guarantee future results or profitability - NOT INDIVIDUAL INVESTMENT ADVICE.
The Secular Market Cycle
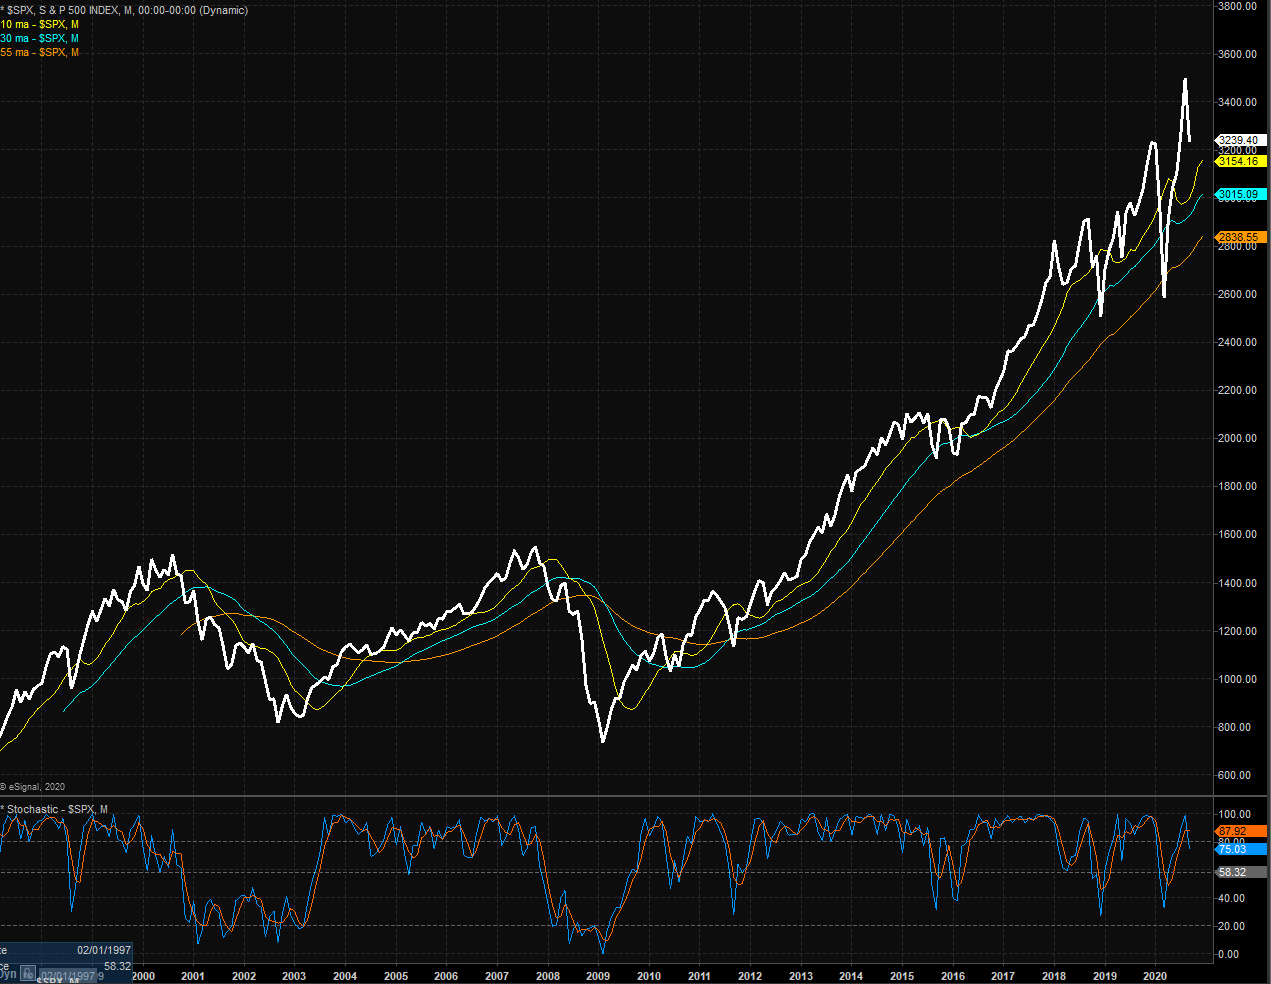
Definition: A secular bull market is a period in which stock prices rise at an above-average rate for an extended period (think 5 years or longer) and suffer only relatively short intervening declines. A secular bear market is an extended period of flat or declining stock prices. Secular bull or bear markets typically consist of multiple cyclical bull and bear markets. Below is a monthly chart of the S&P 500 Index illustrating the current cycle, which we estimate began on March 9, 2009.
S&P 500 - Monthly
(Click on image to enlarge)
The Cyclical Market Cycle
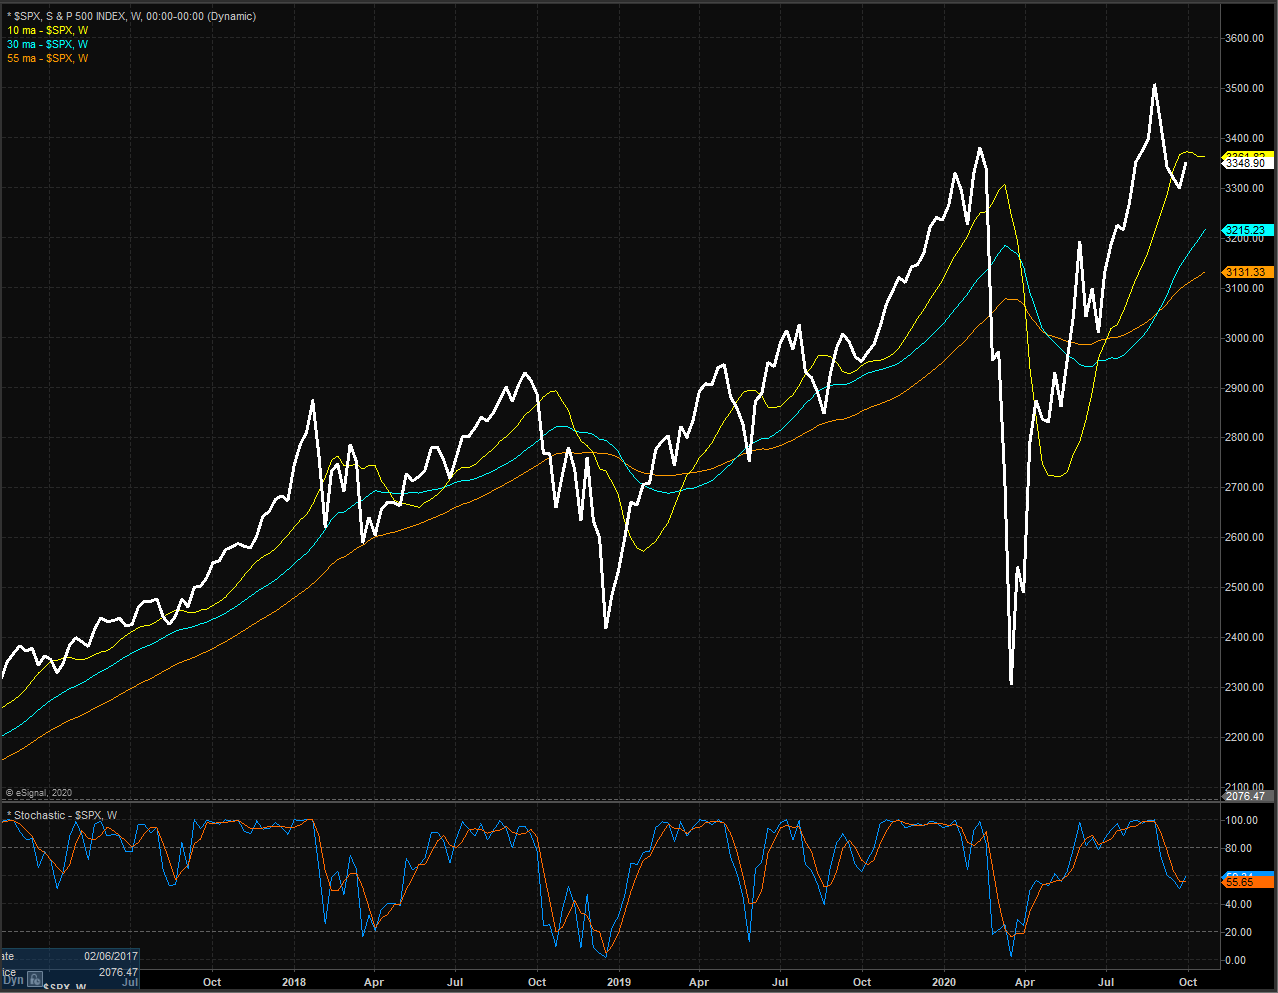
Definition: A cyclical bull market requires a 30% rise in the DJIA after 50 calendar days or a 13% rise after 155 calendar days. Reversals of 30% in the Value Line Geometric Index since 1965 also qualify. A cyclical bear market requires a 30% drop in the DJIA after 50 calendar days or a 13% decline after 145 calendar days. Reversals of 30% in the Value Line Geometric Index also qualify. Below is a weekly chart of the S&P 500 illustrating the current cycle, which we estimate began on March 24, 2020.
S&P 500 - Weekly
(Click on image to enlarge)



Comments
Log in or sign up to join the conversation.