
Markets were fragmented Wednesday as sectors like financials, the dollar and retail dropped while emerging markets and gold rallied.
Retail Sales fell much more than expected (ex-Autos -0.3% vs prior 0.1%); PPI readings were also much below the Fed’s magic 2% number (-0.5% vs prior 0.0%) and Business Inventories were flat (0.0% vs prior 0.0%). Overseas China PMI declined 5.9% which is negative for GDP there. The largest component of the decline was in imports pointing to a lack of demand.
On the earnings front reports from banks show weakening trading profits. And, worse yet was Walmart’s (WMT) weak report and future guidance warnings. The stock fell nearly 10%.
Intel’s (INTC) beat three times lowered expectations, allowing the stock to rally since the report wasn’t as bad as expected.
Investors are at a crossroads trying to resolve the riddle whether bad news is good or bad. It continues to be bizarre to deal with this nonsense. And, perhaps importantly, stocks are no longer severely overbought.
Market sectors moving higher included: Semiconductors (SMH), Biotech (IBB), Energy (XLE), Materials (XLB), Gold (GLD), Gold Stocks (GDX), Emerging Markets (EEM), Europe (IEV), UK (EWU), Austria (EWO), France (EWQ), South Korea (EWY), Indonesia (IDX), Taiwan (EWT), Russia (RSX), Brazil (EWZ), US Treasurys (TLT), Euro (FXE), Pound (FXB), Swiss Franc (FXF), Canadian Dollar (FXC), China (FXI), Malaysia (EWM), New Zealand (ENZL), Australia (EWA) and many more.
Market sectors moving lower included: Financials (XLF), Banks (KBE), Dow (DIA), Consumer Discretionary (XLY), Consumer Staples (XLP), Retail (XRT), Homebuilders (ITB), Industrials (XLI), REITS (IYR), Small Caps (IWM), Japan (EWJ), Hedged Japan (DXJ), Dollar (UUP) and so forth.
The top ETF daily market movers by percentage change in volume whether rising or falling is available daily.
Volume was moderate Wednesday and breath per the WSJ was negative overall.

Charts of the Day
-
SPY 5 MINUTE


-
SPX DAILY

-
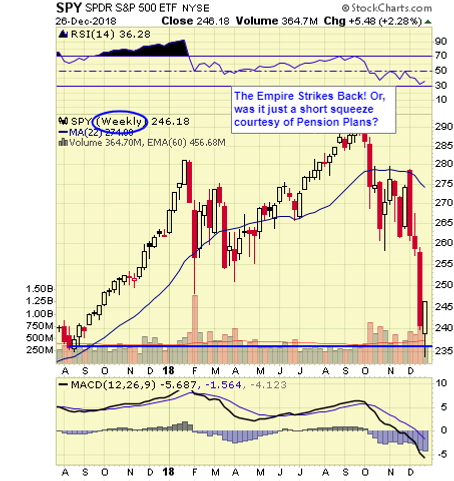
SPX WEEKLY

-
INDU DAILY

-
INDU WEEKLY

-
RUT WEEKLY

-
NDX WEEKLY

-
SOXX WEEKLY

-
XLB WEEKLY

-
XLE WEEKLY

-
XLF WEEKLY

-
XLY WEEKLY

-
XRT WEEKLY

-
XLP WEEKLY

-
IBB WEEKLY

-
XLV WEEKLY

-
ITB WEEKLY

-
IYR WEEKLY

-
IYT WEEKLY

-
HYG WEEKLY

-
TLT WEEKLY

-
UUP WEEKLY

-
FXE WEEKLY

-
FXB WEEKLY

-
GLD MONTHLY

-
GDX MONTHLY

-
SLV WEEKLY

-
DBB MONTHLY

-
USO MONTHLY

-
DBA WEEKLY

-
EFA WEEKLY

-
IEV WEEKLY

-
EEM WEEKLY

-
ENZL WEEKLY

-
EWA WEEKLY

-
EWU WEEKLY

-
THD WEEKLY

-
EWJ WEEKLY

-
EWZ WEEKLY

-
EPI WEEKLY

-
NYMO DAILY

The NYMO is a market breadth indicator that is based on the difference between the number of advancing and declining issues on the NYSE. When readings are +60/-60 markets are extended short-term.
-
NYSI DAILY

The McClellan Summation Index is a long-term version of the McClellan Oscillator. It is a market breadth indicator, and interpretation is similar to that of the McClellan Oscillator, except that it is more suited to major trends. I believe readings of +1000/-1000 reveal markets as much extended.
-
VIX WEEKLY

The VIX is a widely used measure of market risk and is often referred to as the "investor fear gauge". Our own interpretation is highlighted in the chart above. The VIX measures the level of put option activity over a 30-day period. Greater buying of put options (protection) causes the index to rise
Economic news remains weak and headline company earnings reports are disturbingly weak. Those in control of the tape are just expecting the Fed to do nothing and that in itself is bullish, but the bad news is good theme is transitory.
Thursday yields more earnings and economic data like Consumer Price Index, Jobless Claims, Empire State Mfg Survey, Philly Fed Business Outlook and a slew of jawboning speeches by Fed Governors Bullard, Dudley, and Meister.
Let’s see what happens.


Comments
Log in or sign up to join the conversation.