


The Fed will be the main catalyst for markets this week, with Wednesday’s rate decision creating the potential for a significant repricing across stocks, bonds, and volatility. With little economic data between now and the meeting to change expectations, the market will have few opportunities to resolve that uncertainty beforehand. That should push implied volatility higher and make it difficult for stocks to advance meaningfully into Wednesday afternoon.
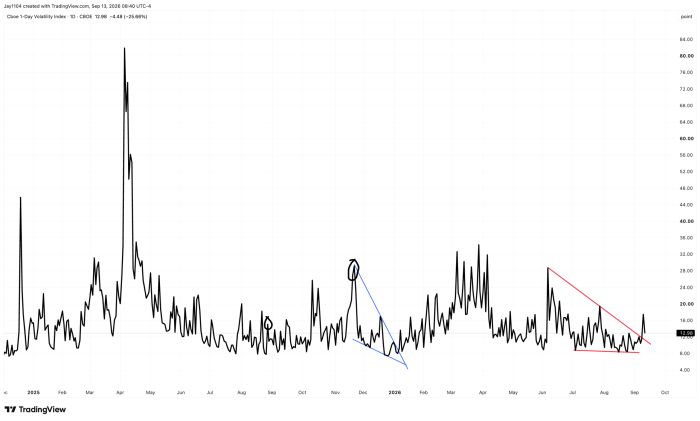
By 1:59 p.m. ET on Wednesday, there is a very good chance we could be looking at the VIX 1-Day trading around the 20 region, up sharply from 13 on Friday afternoon.
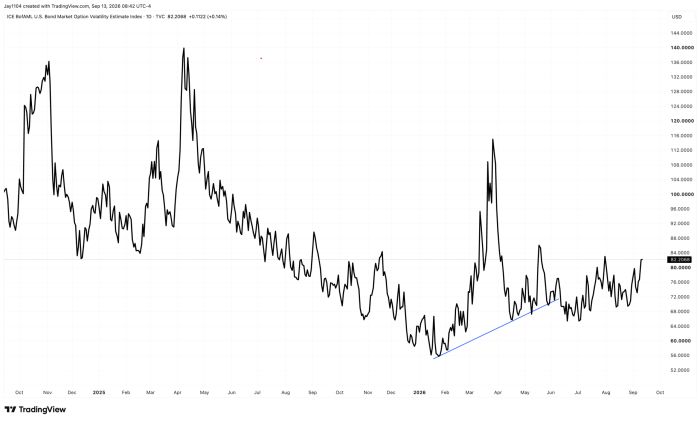
Bond market volatility should rise as well, with the MOVE Index likely to move higher from its current reading of 82 through Tuesday’s close.
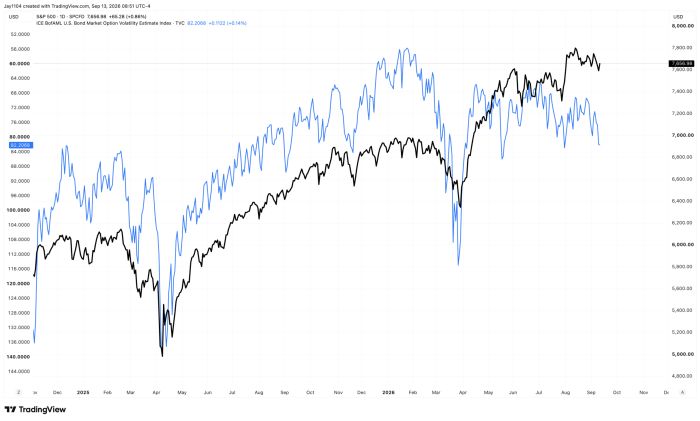
The setup is fairly straightforward: as the Fed meeting approaches, the market should demand a larger volatility premium for the risk of a significant policy repricing. Rising implied volatility would then become a headwind for equities. The inverted MOVE Index continues to serve as a good proxy for where the S&P 500 is likely to head, so if volatility rises as expected, it would point to increasing downside pressure on the index ahead of the Fed decision.
On liquidity, September is a month of Treasury paydowns, which should provide some support as cash returns to the market rather than being absorbed through net issuance. But that window is small. This week is likely to be the peak, with $29 billion in net paydowns on Tuesday and another $14 billion on Thursday. The amounts shrink from there before Treasury returns to net issuance in October, which will continue through December.
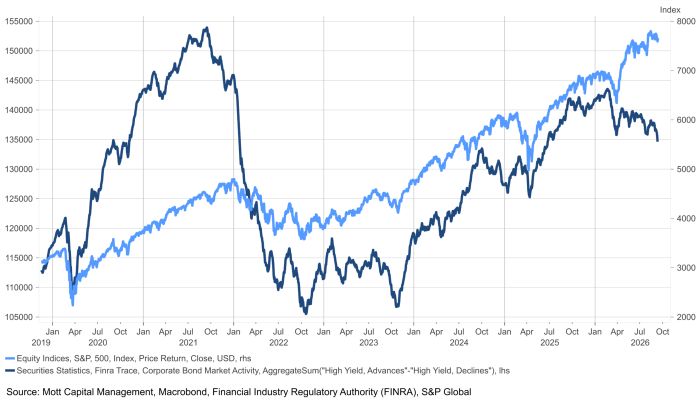
What is more concerning is that liquidity conditions are already deteriorating despite those paydowns. The high-yield advance-decline line, which has been a useful gauge of market liquidity, recently fell to a new 52-week low. In other words, even with Treasury temporarily putting cash back into the system, the underlying liquidity picture continues to weaken.
The NYSE McClellan Summation Index is sending a similar message. It has fallen below zero after failing to break above 500. Because the index measures the cumulative strength of market breadth, the failure to reach 500 suggested that the rally that began in March never developed broad enough participation to become self-sustaining. The subsequent move below zero signals that declining stocks are increasingly dominating advancing stocks, confirming the deterioration beneath the surface of the broader market.
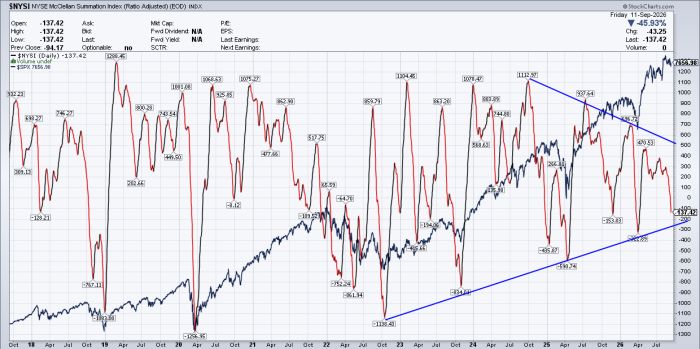
That makes what comes next more important. September’s liquidity support is temporary, and Treasury returns to net issuance in October. If that coincides with the Fed beginning a rate-hiking cycle, widening credit spreads, and slowing money growth, liquidity conditions could tighten considerably further.
So the warning is not simply that liquidity looks weak today. It is that liquidity is deteriorating during a period when Treasury paydowns should be providing support. Once that support fades, the pressure could become much more pronounced, making these liquidity and breadth gauges increasingly important to watch.



Comments
Log in or sign up to join the conversation.