

|
Indicator |
Weekly Level / Change |
Implication for S & P 500 |
Implication for Nifty* |
|
S & P 500 |
3009, -2.86% |
Bearish |
Bearish |
|
Nifty |
10383, 1.35% |
Neutral ** |
Bullish |
|
China Shanghai Index |
2980, 0.40% |
Neutral |
Neutral |
|
Gold |
1785, 1.81% |
Bullish |
Bullish |
|
WTIC Crude |
38.20, -3.90% |
Bearish |
Bearish |
|
Copper |
2.66, 1.69% |
Bullish |
Bullish |
|
Baltic Dry Index |
1738, 11.77% |
Bullish |
Bullish |
|
Euro |
1.1218, 0.37% |
Neutral |
Neutral |
|
Dollar/Yen |
107.23, 0.32% |
Neutral |
Neutral |
|
Dow Transports |
8806, -3.00% |
Bearish |
Bearish |
|
High Yield (Bond ETF) |
100.96, -2.04% |
Bearish |
Bearish |
|
US 10 year Bond Yield |
0.64%, -7.74% |
Bullish |
Bullish |
|
Nyse Summation Index |
826, -20.38% |
Bearish |
Neutral |
|
US Vix |
34.73, -1.11% |
Bullish |
Bullish |
|
Skew |
138 |
Neutral |
Neutral |
|
20 DMA, S and P 500 |
3107, Below |
Bearish |
Neutral |
|
50 DMA, S and P 500 |
2980, Above |
Bullish |
Neutral |
|
200 DMA, S and P 500 |
3021, Below |
Bearish |
Neutral |
|
20 DMA, Nifty |
10097, Above |
Neutral |
Bullish |
|
50 DMA, Nifty |
9577, Above |
Neutral |
Bullish |
|
200 DMA, Nifty |
10894, Below |
Neutral |
Bearish |
|
S & P 500 P/E |
21.57 |
Bearish |
Neutral |
|
Nifty P/E |
26.67 |
Neutral |
Bearish |
|
India Vix |
28.74, -4.10% |
Neutral |
Bullish |
|
Dollar/Rupee |
75.62, -0.84% |
Neutral |
Bullish |
|
Overall |
S & P 500 |
Nifty |
|
|
Bullish Indications |
6 |
10 |
|
|
Bearish Indications |
8 |
6 |
|
|
Outlook |
Bearish |
Bullish |
|
|
Observation |
The S and P fell and the Nifty fell rallied week. Indicators are mixed for the week. The markets have begun a great depression style collapse. Watch those stops. |
||
|
On the Horizon |
US – Employment data, UK – GDP, Eurozone – CPI, German employment data, |
||
|
*Nifty |
India’s Benchmark Stock Market Index |
||
|
Raw Data |
Courtesy Stock charts, investing.com, multpl.com, NSE |
||
|
**Neutral |
Changes less than 0.5% are considered neutral |
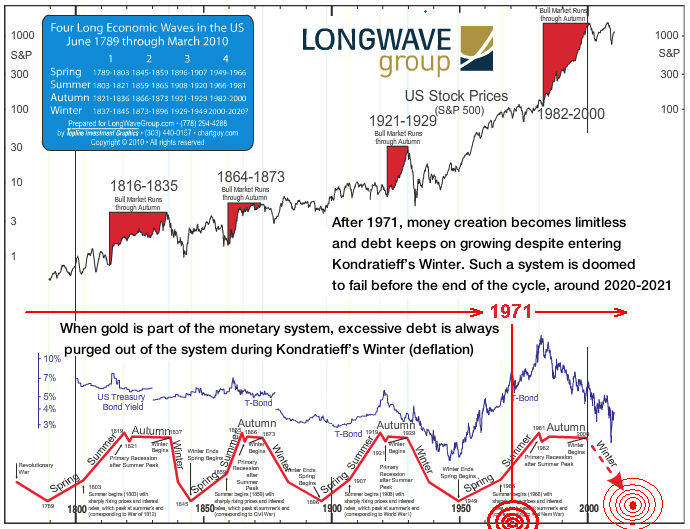
The S&P 500 fell and the Nifty rallied last week. Indicators are mixed for this week, but the recent rally is coming to an end. After extreme euphoria for the indices, a highly probable selloff to the 2700 area is emerging on the S&P, and 8500 should arrive on the Nifty in short order. The Fed is repeating the Japan experiment and the lost 3 decades in Japan (1989-2019) is set to repeat across the globe. SPX 1500 and lower by year-end and we stay there till 2050, scary? The markets are very close to an epic meltdown and the SPX is headed way lower. The markets are overvalued, overbought and out of touch with economic realities. Long term, the epic meltdown is set to continue resulting in a 5 year plus bear market with lot lower levels maybe as low as 800 on the S&P. QE forever from the Fed is about to trigger the deflationary collapse of the century and we have made a major top in global equity markets. The market is looking like the short of a lifetime with non-conformations from the transports, other global indices, and commodities. High valuations continue. The breakdown in Crude and the Euro is a precursor to yet another massive drop in the S&P 500. The recent global virus epidemic (black swan) is likely to dent global GDP significantly and usher in depression much faster than most think. The trend has changed from bullish to bearish and the markets are getting smashed by a strong dollar. Looking for significant underperformance in the Nifty going forward on rapidly deteriorating macros. A 5-year deflationary wave has started in key asset classes like the Euro, stocks, and commodities amidst a number of bearish divergences and overstretched valuations. We are entering a multi-year great depression. The markets are still trading well over 3 standard deviations above their long term averages from which corrections usually result. Tail risk has been very high off late as the yield curve inverts into a recession. The critical levels to watch for the week are 3020 (up) and 2995 (down) on the S&P 500 and 10450 (up) and 10300 (down) on the Nifty. A significant breach of the above levels could trigger the next big move in the above markets. You can check out last week’s report for a comparison. Love your thoughts and feedback. Here's the outlook from@JoeFriday_714:
JF's Sunday Morning Charts - a few charts to chew on for the coming week. 😎 (Full thread inside)#SPX Weekly - A break below the PRZ for C and LOB. pic.twitter.com/McfcxYgDxp
— JoeFriday714 (@joefriday_714) June 28, 2020


Comments
Log in or sign up to join the conversation.