

Greetings from Ouray, CO, where the air is extremely crisp this morning and the mountains are stunning!
As a reminder, I've decided to make an adjustment to the publishing schedule of my blog/oftentimes meandering market missive... Going forward, the plan is to publish a "Model Review" report on Monday mornings. This will be the same group of models that you have come to know over the years. The idea is to start the week with a quick check on the key market models/indicator boards.
In addition, I will strive to provide our view of the primary market drivers (aka, "The State of the Market" report) in a separate post as time permits, which will be published mid-week.
I hope you enjoy the new report schedule
Now let's get the new week started with a review of the "state of the market" from a modeling perspective...
The Big-Picture Market Models
We start with six of our favorite long-term market models. These models are designed to help determine the "state" of the overall market.

* Source: Ned Davis Research (NDR) as of the date of publication. Historical returns are hypothetical average annual performances calculated by NDR.
The Fundamental Backdrop
Next, we review the market's fundamental factors including interest rates, the economy, earnings, inflation, and valuations.
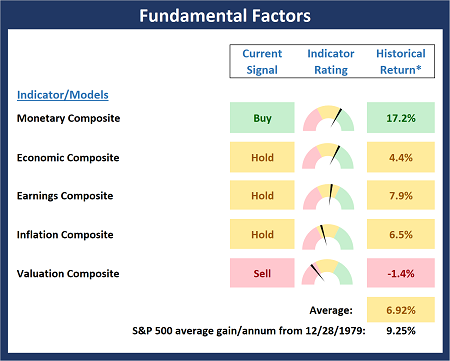
* Source: Ned Davis Research (NDR) as of the date of publication. Historical returns are hypothetical average annual performances calculated by NDR.
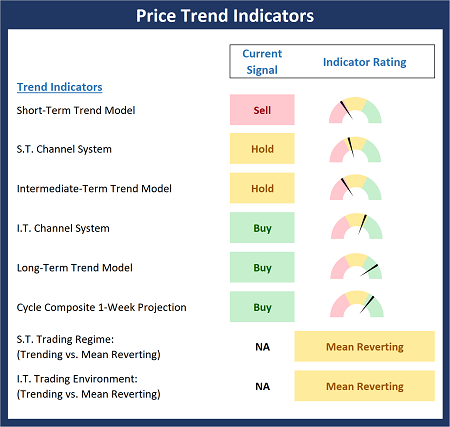
The State of the Trend
After reviewing the big-picture models and the fundamental backdrop, I like to look at the state of the current trend. This board of indicators is designed to tell us about the overall technical health of the market's trend.
The State of Internal Momentum
Next, we analyze the momentum indicators/models to determine if there is any "oomph" behind the current move.
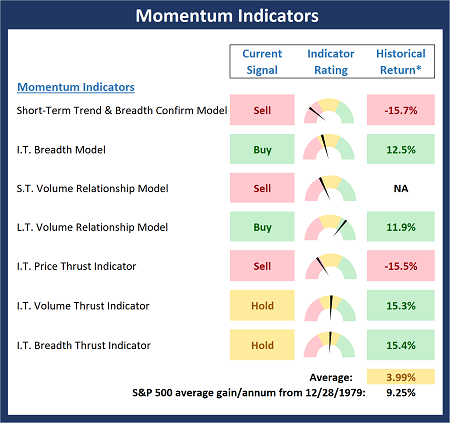
* Source: Ned Davis Research (NDR) as of the date of publication. Historical returns are hypothetical average annual performances calculated by NDR.
Early Warning Signals
Finally, we look at our early warning indicators to gauge the potential for counter-trend moves. This batch of indicators is designed to suggest when the table is set for the trend to "go the other way".
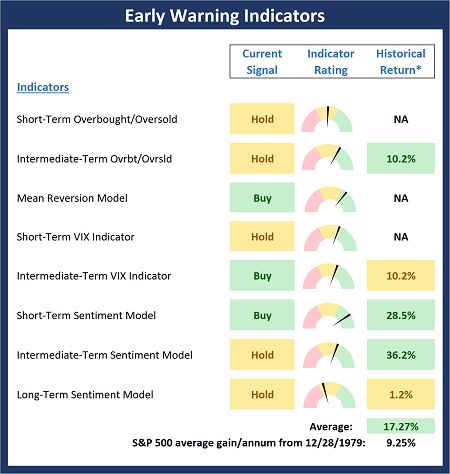
* Source: Ned Davis Research (NDR) as of the date of publication. Historical returns are hypothetical average annual performances calculated by NDR.


Comments
Log in or sign up to join the conversation.