

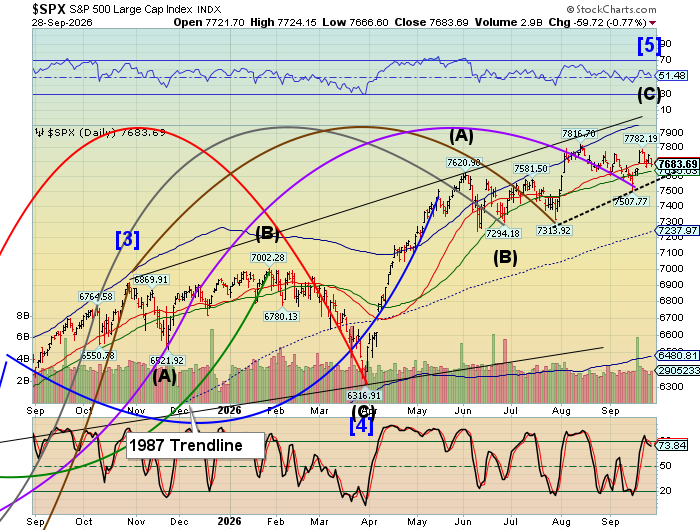
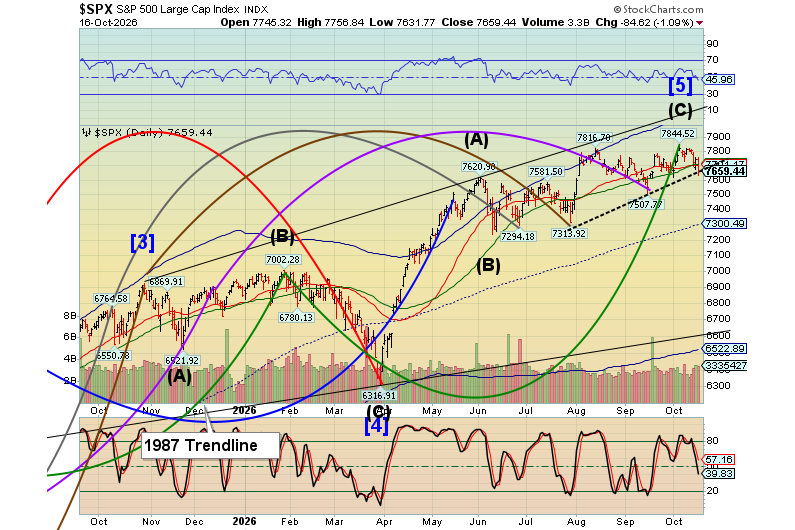
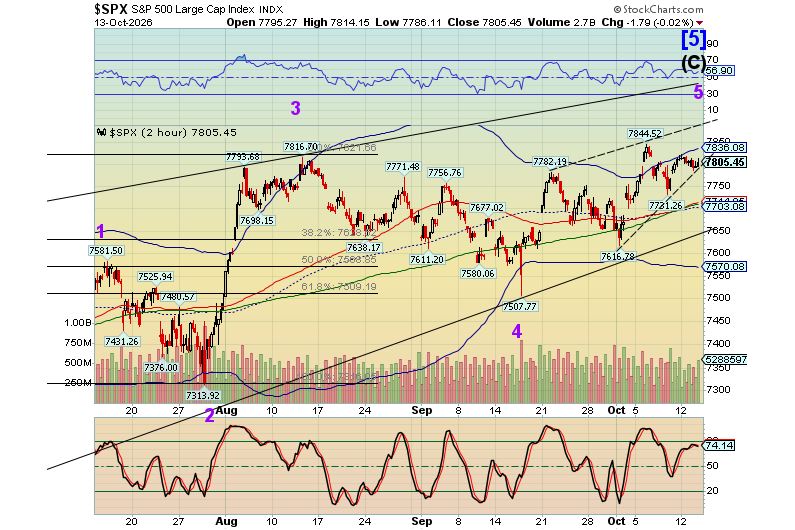
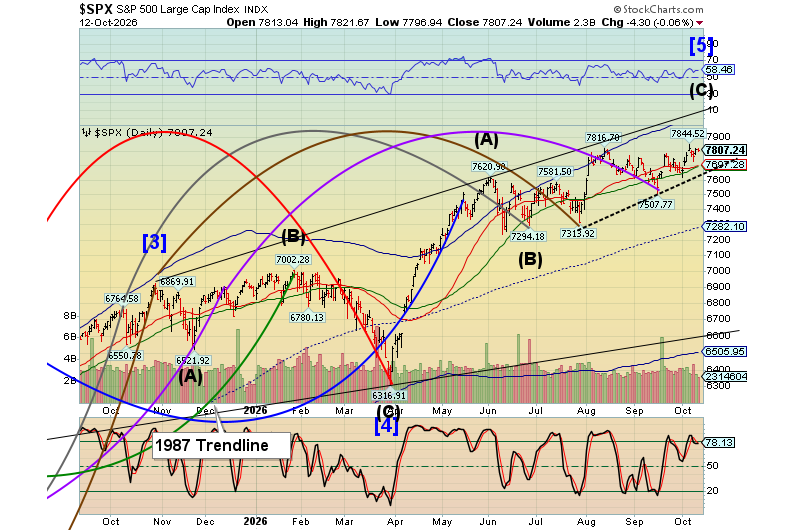
SPX futures declined to 7655.50 overnight, then rose above 7700.00 this morning. It crossed above Intermediate suupport/resistance at 7688.00 and has reiterated its buy signal. The Cycles Model has the SPX rising to the week of October 12, but with little conviction thus far. The Cycle Top resistance rests at 7995.00 and the upper Diagonal trendline lies above 8050.00. In August I had calculated the upper boundary of the top in the SPX near 8100.00. That may remain a legitimate view.
ZeroHedge reports, “US equity futures have reversed earlier losses and trade in the green, near session highs, as bond yields drop across the curve, following a decline in oil which has also hit the dollar, despite lack of any tangible news out of Iran and as traders brace for the week’s first labor data following a neverending firehose of artificial-intelligence news and events.”
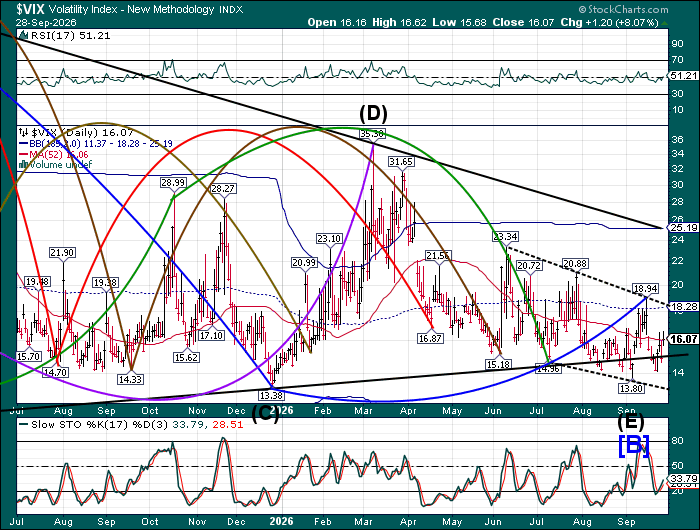
The premarket VIX slipped lower this morning, but remained above the lower Triangle trendline near 15.50. The fractal construct allows the VIX to dexcend to the lower trading channel trendline beneath 13.00. The Cycles Model still makes an allowance for a distinctive tail beneath the Triangle formation.
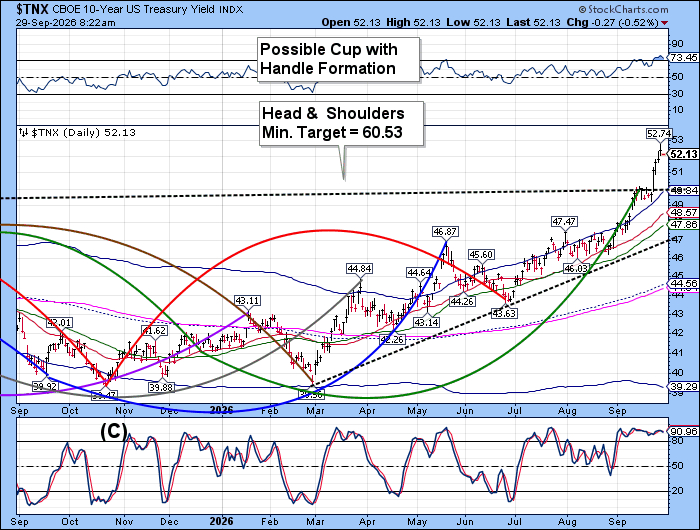
The US 10-year Bond Yield has pulled back from yesterday’s high and may be due fpr a decline to the neckline of the Head & Shoulders formation. Bond shorts are very crowded. The decline in yields may take some negative pressure from equities. The Cycles Model allows the pullback to reach the neckline of the Head & Shoulders formation during the week of October 5.
ZeroHedge comments, “If you wanted a textbook example of a central bank trapped between a geopolitical rock and a stagflationary hard place, welcome to September 2026. To wit: the ongoing standoff in the Strait of Hormuz is tearing through the global energy market, and the resulting inflation shock is vaporizing the bond market.”
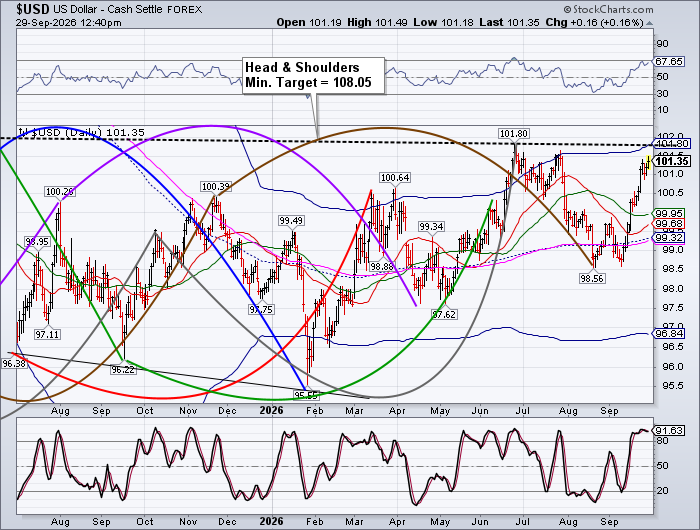
The US Dollar continues its climb towad the head & Shoulders neckline at 101.80. However, momentume is being lost. Should a reversal take place, the decline may reach the 52-day Moving Average in the next two weeks.
Comments
Log in or sign up to join the conversation.