
The U.S. International Trade in Goods and Services, also known as the FT-900, is published monthly by the Bureau of Economic Analysis with data going back to 1992. The monthly reports include revisions that go back several months. This report details U.S. exports and imports of goods and services.
The U.S. monthly international trade deficit increased in March 2019 according to the U.S. Bureau of Economic Analysis and the U.S. Census Bureau. The deficit increased from $49.3 billion in February (revised) to $50.0 billion in March, as imports increased more than exports. The previously published February deficit was $49.4 billion. The goods deficit increased $0.5 billion in March to $72.4 billion. The services surplus decreased $0.2 billion in March to $22.4 billion.
Here is an excerpt from the latest report:
The U.S. monthly international trade deficit decreased in February 2019 according to the U.S. Bureau of Economic Analysis and the U.S. Census Bureau. The deficit decreased from $51.1 billion in January (revised) to $49.4 billion in February, as exports increased more than imports. The previously published January deficit was $51.1 billion. The goods deficit decreased $1.2 billion in February to $72.0 billion. The services surplus increased $0.5 billion in February to $22.6 billion.
Today's headline number of -50.00B was better than the Investing.com forecast of -50.20B.
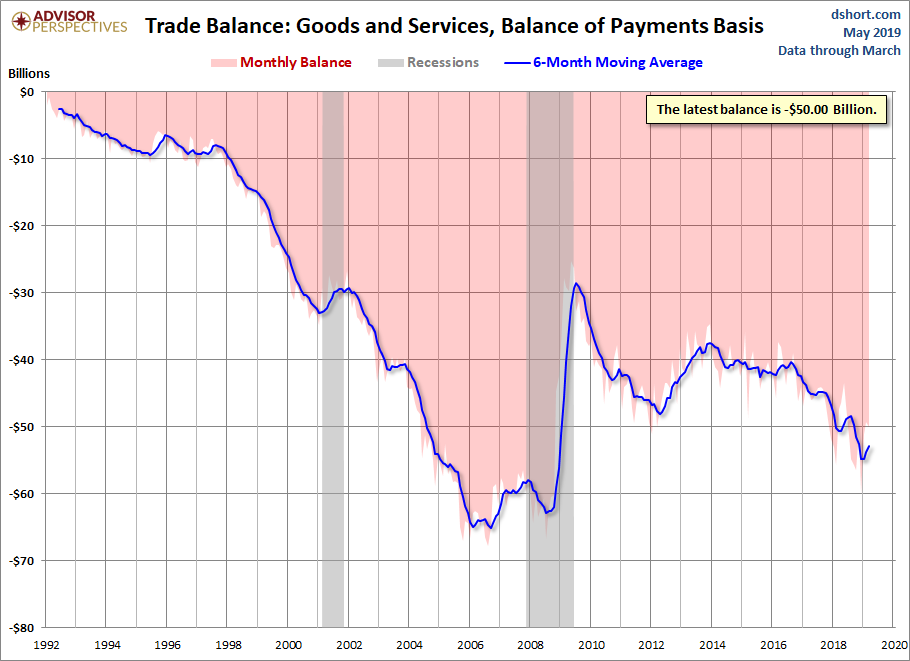
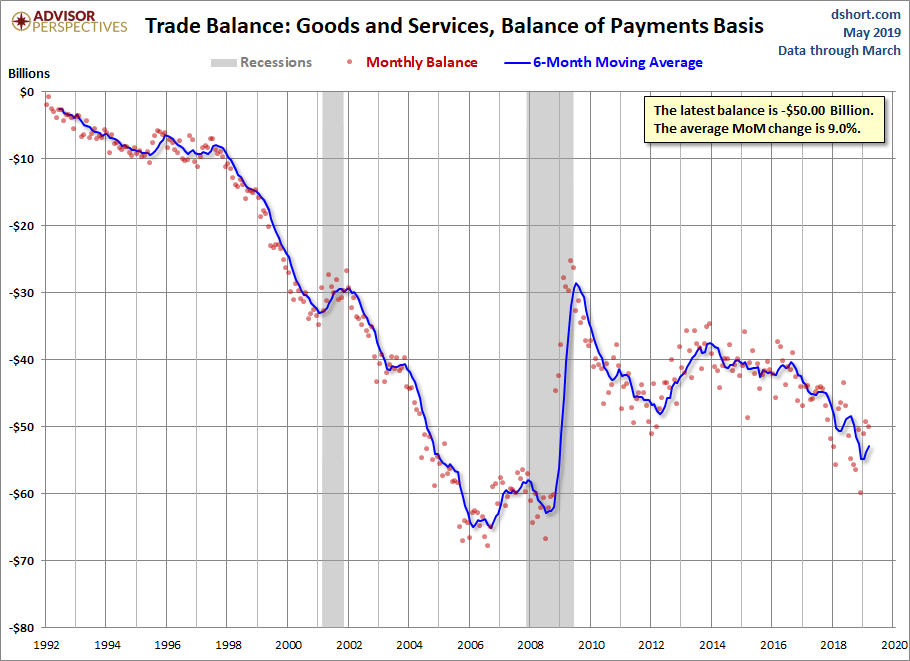
Here is a snapshot that gives a better sense of the extreme volatility of this indicator.
We will publish the next Trade Balance report on June 6.


Comments
Log in or sign up to join the conversation.