

The Empire State Manufacturing Survey index significantly declined to levels not seen since the Great Recession in 2009.

Analyst Opinion of Empire State Manufacturing Survey
Key elements significantly declined - it seems we are in a recession.
Econintersect reminds you that this is a survey (a quantification of opinion). Please see caveats at the end of this post. However, sometimes it is better not to look too deeply into the details of a noisy survey as just the overview is all you need to know
- Expectations from Econoday were between -5.0 to 8.0 (consensus 4.8 (February 2019) versus the -21.5 reported. Any value above zero shows expansion for the New York area manufacturers.
- New orders sub-index of the Empire State Manufacturing declined and is now in contraction, whilst the unfilled orders also declined but remained barely in expansion
- This noisy index has moved from 10.1 (April 2019), 17.8 (May), -8.6 (June), 4.3 (July), 4.8 (August), 2.0 (September), 4.0 (October), 2.9 (November), 3.5 (December), 4.8 (January 2020), 12.9 (February) - and now -21.5
From the report:
Business activity declined in New York State, according to firms responding to the March 2020 Empire State Manufacturing Survey. The headline general business conditions index fell thirty-four points to -21.5, its lowest level since 2009. The new orders index dropped to -9.3, pointing to a decline in orders, and the shipments index fell to -1.7. Delivery times lengthened slightly, and inventories increased. Employment levelled off, and the average workweek declined. Input price increases were little changed, while selling prices increased at a slower pace than last month. Optimism about the six-month outlook fell sharply, with firms less optimistic than they have been since 2009.
ACTIVITY DECLINES
Manufacturing firms in New York State reported that business activity declined. The general business conditions index fell thirty-four points to -21.5, its largest point drop on record, and its lowest level since 2009. Twenty percent of respondents reported that conditions had improved over the month, while 42 percent reported that conditions had worsened. The new orders index turned negative, falling thirty-one points to -9.3, indicating that orders fell. The shipments index moved down to -1.7, indicating that shipments were little changed. Delivery times were slightly longer and inventories were somewhat higher.
LABOR MARKET INDICATORS WEAKEN
The index for number of employees fell eight points to -1.5, indicating that employment levels were little changed over the month. The average workweek fell to -10.6, a sign that the average workweek was shorter. The prices paid index held steady at 24.5, suggesting that input prices increased at the same pace as last month, while the prices received index fell seven points to 10.1, pointing to a deceleration in selling price increases.
OPTIMISM ABOUT FUTURE ACTIVITY WANES
Firms no longer expect general business conditions to be better over the next six months. The index for future business conditions declined twenty-two points to 1.2, its lowest level since 2009. The indexes for future new orders and future shipments declined, but remained firmly positive, suggesting that firms expect orders and shipments to be higher compared with this month's levels. The capital expenditures index fell three points to 18.7, and the technology spending index fell seven points to 14.4.

z empire1.PNG
The above graphic shows that when the index is in negative territory that it is not a signal of a recession - of 10 times in negative territory (since the Great Recession) - no recession occurred. Conversely, a positive number is likely to be indicating economic expansion. Historically, when it does make a correct negative prediction it can be timely - this index was only two months late in going negative after what was eventually determined to be the start of the 2007 recession.
This survey has a lot of extra bells and whistles which take attention away from the core questions: (1) are orders and (2) are unfilled orders (backlog) improving? - and the answer is that the key internals declined.

Unfilled order contraction can be a signal for a recession.
Summary of all Federal Reserve Districts Manufacturing:
Richmond Fed (hyperlink to reports):

Kansas Fed (hyperlink to reports):

Dallas Fed (hyperlink to reports):

Philly Fed (hyperlink to reports):

New York Fed (hyperlink to reports):

Federal Reserve Industrial Production - Actual Data (hyperlink to report):
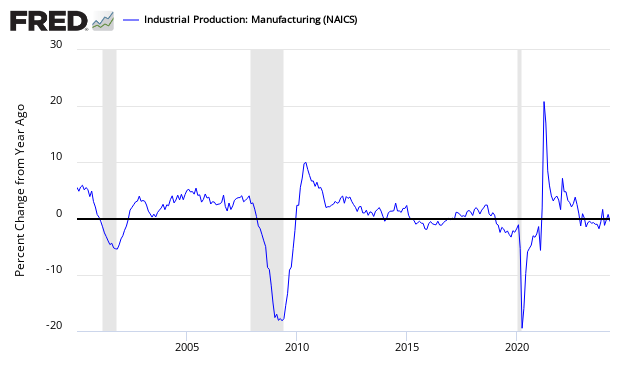
Holding this and other survey's Econintersect follows accountable for their predictions, the following graph compares the hard data from Industrial Products manufacturing subindex (dark blue bar) and US Census manufacturing shipments (red bar) to the New York Fed survey (green bar).

In the above graphic, hard data is the long bars, and surveys are the short bars. The arrows on the left side are the key to growth or contraction.
Caveats on the use of the Empire State Manufacturing Survey:
This is a survey, a quantification of opinion - not facts and data. Surveys lead hard data by weeks to months and can provide early insight into changing conditions. Econintersect finds they do not necessarily end up being consistent compared to hard economic data that comes later, and can miss economic turning points.
According to Econoday:
The New York Fed conducts this monthly survey of manufacturers in New York State. Participants from across the state represent a variety of industries. On the first of each month, the same pool of roughly 175 manufacturing executives (usually the CEO or the president) is sent a questionnaire to report the change in an assortment of indicators from the previous month. Respondents also give their views about the likely direction of these same indicators six months ahead.
This Empire State Survey is very noisy - and has shown recessionary conditions throughout the second half of 2011 - and no recession resulted. Overall, since the end of the 2007 recession - this index has indicated two false recession warnings.
No survey is accurate in projecting employment - and the Empire State Manufacturing Survey is no exception. Although there is some general correlation in trends, month-to-month movements have not correlated with the BLS Service Sector Employment data.
Over time, there is a general correlation with real manufacturing data - but month-to-month conflicts are frequent.


Comments
Log in or sign up to join the conversation.