

The headlines say seasonally adjusted Industrial Production (IP) declined month-over-month. Our analysis shows the three-month rolling average declined.

Analyst Opinion of Industrial Production
Note that the annual data revisions were included in this month's data:
The Federal Reserve Board issued its annual revision to the index of industrial production (IP) and the related measures of capacity utilization on March 27, 2019. The Economic Census for 2017 was not available from the U.S. Census Bureau, so no new annual benchmark data were included for manufacturing. Other annual data, including information on the mining of metallic and nonmetallic minerals (except fuels), were incorporated. The updated IP indexes included revisions to the monthly indicator (either product data or input data) and to seasonal factors for each industry. In addition, the estimation methods for some series were changed. Modifications to the methods for estimating the output of an industry affected the index from 1972 to the present.
There was an upward revision to the last 6 months of data. The best way to view this is the 3-month rolling averages which declined. Industrial production remains in a downtrend.
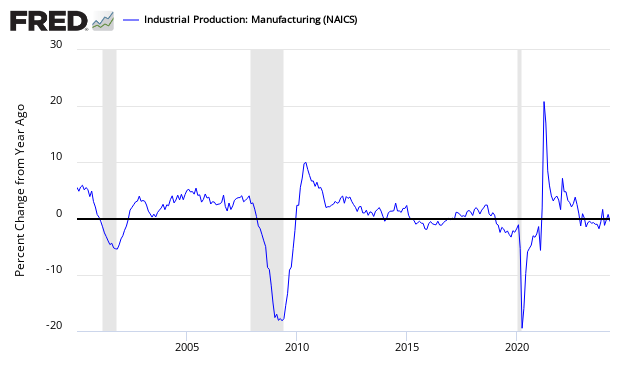
Note that manufacturing is only up 1.0 % year-over-year.
The rate of year-over-year growth for manufacturing employment and manufacturing production correlates.
(Click on image to enlarge)

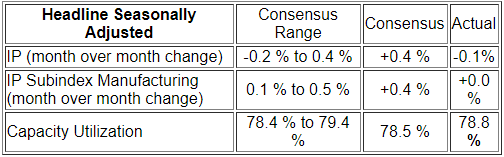
- Headline seasonally adjusted Industrial Production (IP) was down 0,1 % month-over-month and up 2.8 % year-over-year (YoY was published as 3.5 % last month).
- Econintersect's analysis using the unadjusted data is that IP growth was down 0.7 % month-over-month, and is up 2.8 % year-over-year.
- The unadjusted 3 month rolling average year-over-year rate of growth decelerated 0.2 % from last month, and is up 3.2 % year-over-year.
- The market was expecting (from Econoday):
(Click on image to enlarge)
IP headline index has three parts - manufacturing, mining and utilities - manufacturing was up 0.0 % this month (up 1.0 % year-over-year), mining down 0.8 % (up 10.5 % year-over-year), and utilities were up 0.2 % (up 3.8 % year-over-year). Note that utilities are 10.4 % of the industrial production index, whilst mining is 14.6 %.
Comparing Seasonally Adjusted Year-over-Year Change of the Industrial Production Index (blue line) with Components Manufacturing (red line), Utilities (green line), and Mining (orange line)
(Click on image to enlarge)

Unadjusted Industrial Production year-over-year growth has been declining since mid-2018.
(Click on image to enlarge)

Economic downturns have been signaled by only watching the manufacturing portion of Industrial Production. Historically manufacturing year-over-year growth has been negative when a recession is imminent.
Seasonally Adjusted Manufacturing Index of Industrial Production - Year-over-Year Growth
(Click on image to enlarge)
Seasonally Adjusted Capacity Utilization - Year-over-Year Change - Seasonally Adjusted - Total Industry (blue line) and Manufacturing Only (red line)
(Click on image to enlarge)

Econintersect uses unadjusted data and graphs the data YoY in monthly groups.
(Click on image to enlarge)

Summary of all Federal Reserve Districts Manufacturing:
Holding this and other survey's Econintersect follows accountable for their predictions, the following graph compares the hard data from Industrial Products manufacturing subindex (dark blue bar) and US Census manufacturing shipments (lighter blue bar) to the Dallas Fed survey (light blue bar).
(Click on image to enlarge)

In the above graphic, hard data is the long bars, and surveys are the short bars. The arrows on the left side are the key to growth or contraction.
Caveats in the Use of Industrial Production Index
Industrial Production is a non-monetary index - and therefore inflation or other monetary adjustments are not necessary. The monthly index values are normally revised many months after initial release and are subject to annual revision. The following graphic is an example of the variance between the originally released value - and the current value of the index. If the current values are better than the original values - this is normally a sign of an improving economy.
(Click on image to enlarge)

This index is somewhat distorted by including utility production which is noisy, based primarily on weather variations. There is some variance between the manufacturing component of industrial production which monitors production, and the US Census reported Manufacturing Sales. While it is true that these are slightly different pulse points (inventory not accounted in shipments) - they should not have different trends for long periods of time.
Comparing Year-over-Year Change - Unadjusted Manufacturing Industrial Production (blue line) to Unadjusted Manufacturers Shipments (green line)
(Click on image to enlarge)

Econintersect determines the month-over-month change by subtracting the current month's year-over-year change from the previous month's year-over-year change. This is the best of the bad options available to determine month-over-month trends - as the preferred methodology would be to use multi-year data (but New Normal effects and the Great Recession distort historical data).


Comments
Log in or sign up to join the conversation.