
- Goldman goes soft on BRICs.
- Crude at $80? In 2020 says the IEA.
- Moody’s Forecasts moderate global economic growth.
- The junk debt rally runs low on steam.
- What is different this time?
- The 10-year UST note rallies on strong auction demand.
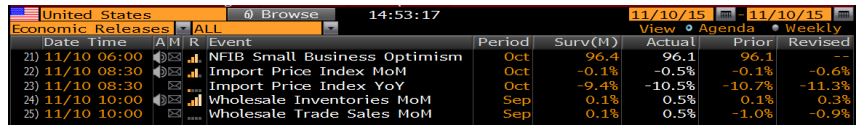
Numbers:
(Click on image to enlarge)
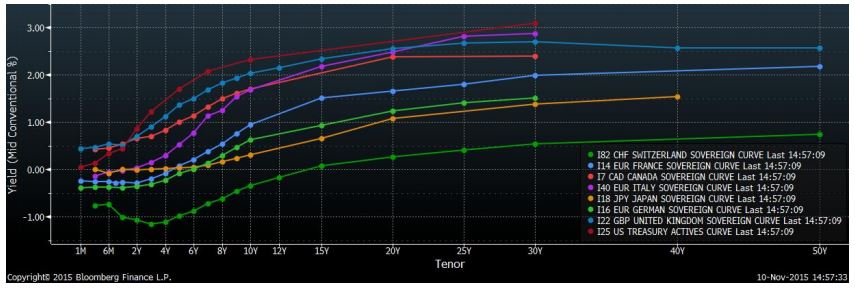
Yield Curves:
(Click on image to enlarge)
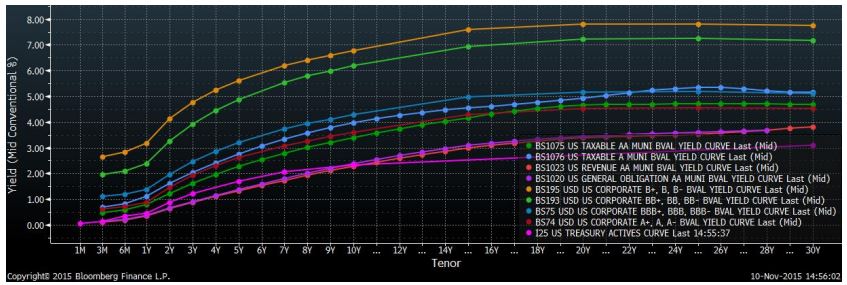
Credit Curves:
(Click on image to enlarge)
Making Sense:
We have several topics worthy of discussion today. So sit back, grab a coffee or tea and enjoy some relaxing bond market reading.
Thick as a BRIC
Goldman Sachs has become less sanguine on the Brazil, Russia, India and China (BRIC) story. Craig Pirrong, a University of Houston finance professor, told the Wall Street Journal: “I would view this as a confirming signal that the party in commodities, and BRICs, is over.” GS spokesman, Andrew Williams stated: “If I were to change it, I would just leave the ‘C, but then, I don’t think it would be much of an acronym.” I would just leave the “I” from the group, but that is what makes markets. GS still believes EM should be a strategic part of investor portfolios. I believe it should be a tactical part of portfolios and individual countries should be chosen. At present, I prefer net commodity consuming economies versus net commodities producers. However, EM investing is not suitable for all investors. As such, please contact me directly for specific recommendations.
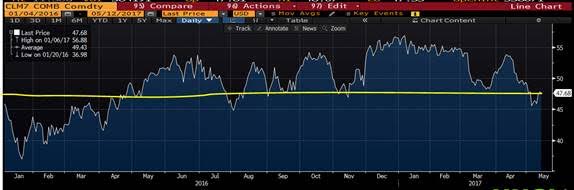
Green Grass and Low Prices Forever?
The IEA announced that it does not expect the price of crude oil to return to the $80 per barrel level until 2020. By that time, the IEA believes that OPEC will have squeezed out many of its rivals. This contrasts sharply with the popular outlook from earlier this year that the price of WTI might reach $80 by the end of 2015. This also contrasts sharply with the opinion of Citigroup energy analyst, Anthony Yuen, who believes that crude oil prices will probably settle in to the $50 to $60 range during the next several years and that OPEC could fracture during the next five or six years.
Although Mr. Yuen’s outlook makes much more sense to me, in a world where the U.S. is likely to be the swing producer, forecasting out five years, or even three years, is borderline foolish. Few saw the plunge in oil which began in 2014. Few believed that shale producers could be profitable below $80 a barrel. According to presenters at last week’s Global Interdependence Center energy conference, most U.S. shale producers are profitable at the $50 level. Most of OPEC (other than the Saudi’s) need oil near or over $100 a barrel. The difference is that U.S. producers are more efficient and they have the private sector ability to increase efficiencies as technology allows, without the baggage from a central energy policy and government-dictated wage and hiring policies. If you think that the grass is greener in foreign backyards, I would suggest you check to see if the green paint is still wet before climbing the proverbial fence.
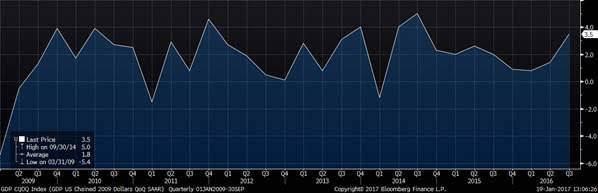
Moody’s Blues
Moody’s 2015-2017 G20 GDP forecast calls for economic growth of 2.8%. Moody’s forecasts G20 GDP of 2.6% in 2015, 2.8% in 2016 and 3.00% in 2017. Moody’s China GDP growth forecast is expected to be just under 7% in 2015, 6.3% in 2016 and 6.1% in 2017. According to Moody’s, “muted 3 economic growth will not support a significant reduction in government debt or allow central banks to raise interest rates markedly.” Moody’s also expressed concern that central bankers might not have enough weapons to combat an unexpected economic shock. Some may view Moody’s forecast as gloomy, but I see it as realistic. Levels of growth, particularly in EM, were unsustainable, given economic, political and social realities. Yes, China growing at 6.1% is still impressive. It is even more impressive when one considers that it would be 6.1% growth on a much larger economy versus just a few years ago. However, many asset and commodity valuations were based on 8% to 10% growth from a consistently larger Chinese economy. Also assumed was that China’s demand for commodities would remain as robust as before (if not more so). This was unrealistic when one considers that China’s economy is maturing. Now the government is having difficulty steering this unwieldy behemoth. The answer is probably to transition to a more market based democratic system, but recent comments from China’s leadership indicate a reluctance to do so.
Locomotive Breath
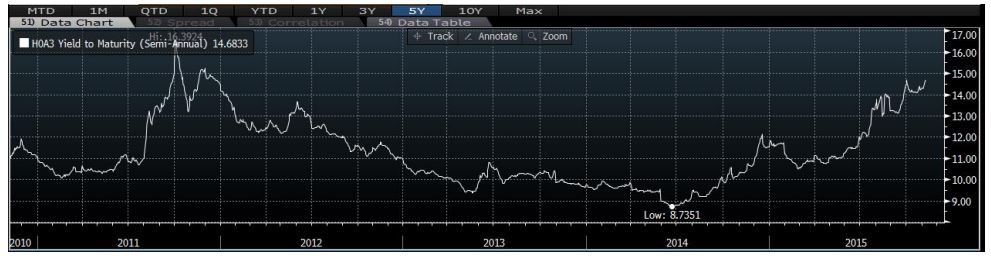
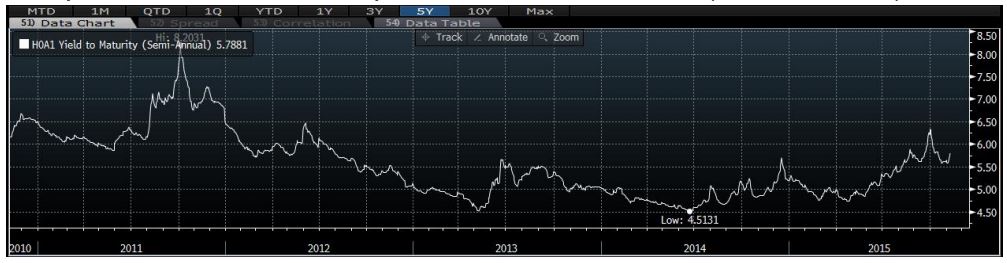
Several weeks ago, I pointed out that it appeared the junk bond recovery was running out of steam. For the past three weeks, the yields of CCC & lower rated U.S. corporate bonds have trended higher. For the past several weeks I opined that it could be just a matter of time before higher-rated areas of high yield debt also saw their recovery rallies run out of steam. This has, in fact, occurred.
Composite CCC & Lower U.S. Corp. Bond Yields since 2010 (Source: BAML):
(Click on image to enlarge)
Composite BB-rated U.S. Corp. Bond Yields since 2010 (Source: BAML):
(Click on image to enlarge)
Some readers might wonder why I used charts of yields rather than charts of credit spreads to detail the performance of high yield debt. After all, U.S. Treasury yields have spiked in recent weeks (mostly last week). I did this for a reason. For about three years, junk debt salespeople have enticed 4 investors and advisors by noting that junk bond spreads usually narrow and/or junk debt prices tend to rally when (or just before) interest rates begin trending higher. There is some truth to this. However, when in the past did the Fed keep rates at ZIRP for going on seven years and engage in three rounds of QE (with a maturity twist thrown in)? The answer is: Never.
Because of this I hypothesized that Fed policies would probably result in high yield debt credit spreads reaching their cyclically-narrow levels well before the Fed began tightening monetary policy. I bounced my theory off of several high yield trader friends and they unanimously concurred. When high yield credit spreads reached their post-recession narrow conditions in June 2014, I suggested moving up in quality. Market data indicate that credit spreads began narrowing last month, but the spread recovery also appears to be running out of steam.
The question is: Are their values to be had in high yield debt? Possibly, if one is aggressive. It is possible that one might receive a positive total return when investing in high yield debt. However, in the low-B to CC range of junk debt, one should not expect to receive par at maturity (in many instances). One should go into deep junk debt with the objective of receiving more in a debt restructuring or bankruptcy settlement than what one paid. If you get to clip a few coupons or get par at maturity, consider that gravy. BB-rated bonds typically have a better chance of making timely interest payments and maturing at par than their lower rated brethren. It is in this area of high yield that I see potential value (on a risk versus reward basis) for aggressive and/or sophisticated investors. As always, suitability matters most.
The high yield market is teaching investors and advisors a tough lesson in blindly using the past as a guide for the future. Past can be prelude, but one must consider the context in which past events and trends occurred. Trying to compare what might happen during the forthcoming Fed tightening is probably foolish, if one considers the context yesterday’s Fed tightening versus Fed tightening of the past. There is little which is similar between yesterday’s Fed tightening cycle and any past tightening cycle. Not acknowledging the difference can lead investors and advisors into a post hoc, ergo propter hoc fallacy (“after this, therefore because of this”) trap.
Direct and Indirect Connection
Since long-dated UST yields spiked last week, some pundits have renewed their call for the UST 10-year note yield to begin marching back toward 3.00%. Not so fast.
Yesterday, the U.S. Treasury auctioned the first new 10-year note ($24 billion) since August. Apparently higher yields attract investors. The bid-to-cover ratio, which gauges demand, was little changed at 2.58 versus a prior 2.59. This was much better than the bid-to-cover ratio of 2.40 the last time the Treasury offered a new 10-year note in August. Indirect bidders (which include central banks) bought 60.5% of the new issuance, down slightly from a prior 62.5%. However, direct bidders, which include individual investors, bought 14.3% of the new 10-year note, up from a 10.3% and a paltry 5.8% the last time the Treasury auctioned a new 10-year note in August.
Yesterday’s auction indicates rather clearly that demand for the UST 10-year note remains quite strong. Rather than fearing rising rates, investors saw the recent pop in long-term rates as a potential opportunity in a world in which inflation pressures are expected to remain tame for the foreseeable future. See yesterday’s Import Prices data on the chart at the beginning of this report.
That is all I have for today. As the bond market is closed tomorrow in observance of Veteran’s Day (Remembrance Day in the UK, Canada and other Commonwealth nations). I will be available for consultation, but I will not be able to execute bond orders or obtain bond markets.
I would like to wish the United States Marine Corps a happy 240th birthday. To all of my Leatherneck readers: Semper Fi!
Have a great day.

Comments
Log in or sign up to join the conversation.