

Investopedia via Yahoo Finance took a look at how much money people need to have saved for a comfortable retirement with your home paid off versus not, being single or married and depending on what state you are in.
A mortgage-free couple needs between $700,000 and $1.18 million, $870,000 as median number, depending on the state with Arkansas and North Dakota at the low end and New York and New Jersey at the high end. Actually the only still has a mortgage retirement number they included was the $1.46 million estimate from Northwest Mutual that everyone wrote about a couple of months ago when it came out.
Most of the article was as useless as that last paragraph but there were a couple interesting tidbits. One was that in 1980, only 13% of homeowners 65 and older had a mortgage versus 36% as of 2024. And I thought this graphic was useful.
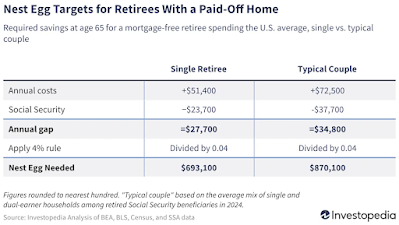
We've articulated what the table displays many times as has probably every site that explores retirement math. The single/couple columns, ok but whatever your marital situation what are your complete expenses? What are monthly expenses, what are your annual/semi annual expenses like property tax and certain types of insurance? Do you track so granularly to factor in oil changes (not a bad idea but we don't) or maybe haircuts (my $20/mo at Great Clips seems a little unnecessary)? Do you pad in an amount for larger, unexpected items like a veterinary bill or something like tires? Whatever your process, just make sure it's thorough.
We just looked at Social Security. The SSA wants us to know our numbers. Then decide if you think it is prudent to assume a reduction in your payout and to be thorough, reduce it by what you expect to pay for Medicare Part B.
That process is what is captured in the table. If there is a gap, can you cover it somehow from some sort of planned earned income, rental income or from an investment portfolio?
At some point in our 50's it probably becomes reasonable to start to frame out what a gap might look like unless someone is hell bent to retire at 50 then they need visibility at a very young age and need to do some math (AI can do this for you) on what their Social Security will look like if they don't get 35 years of earned income in before they stop working.
The annual Social Security report everyone gets notes that the dollar amount assumes a full career duration, if someone stops at 50 then that won't qualify for full benefits. The 35 highest earnings years will include quite a few zeros or if someone actually has earned income starting at 15, a few very low earning years. I wouldn't try to discourage anyone from retiring early if that is what they want but as per the above table, a reduced SS payout due to a shorter working career means needing more saved. Planning, based on the wrong numbers could be catastrophic.
As a matter of personal philosophy, I don't want to rely on just two things, SS and my IRA account. The first two ideas I think most people would come up with for additional income streams is some sort of post retirement gig like monetizing a volunteer endeavor or turning a hobby into an income stream and the other one is rental income. All the better if you can come up with others that work for you.
I actually think of a bridging strategy as being a separate income stream. We've written about this quite a bit lately. This could just be a taxable account that built up over the years or maybe there is some sort of event that funds an account for bridging like maybe the sale of an investment property or some sort of options vesting from an employer.
The way we have framed this out in recent posts, this is a different strategy than the 60/40 or 70/30 that might be in the typical IRA account. If leaving this sort of windfall (house sale or options vesting or just years of accumulation) in cash would last for eight years, could a higher yielding bridging strategy stretch that for ten years until maybe when RMDs start? That's the equation. Leaving an IRA alone for ten years can reasonably see the IRA invested 60/40 come close to doubling.
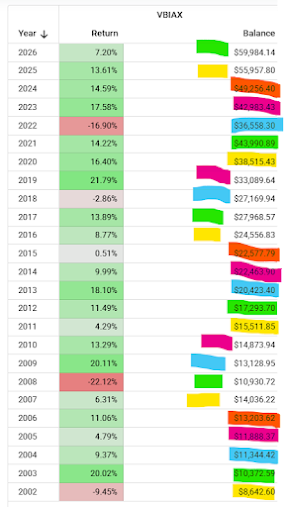
It's a little sloppy but I tried to color code rolling ten year periods for most of this century. The ten years numbers show solid growth. The worst time to invest in this century would have been at the start of 2000 and even then, the cumulative growth for ten years would have been 34%.
I understand that this much work won't appeal to everyone but like many aspects of life, the more we put into retirement planning, the more we will get out of it.



Comments
Log in or sign up to join the conversation.