

One of the best ways I found to gauge the overall strength of the market is to look at the 5 major ETFs: the S&P 500 Large Cap Index (IVV), the S&P 400 Mid Cap Index (NYSEArca: IJH), the S&P 600 Small Cap Index (NYSEARCA: IJR) , the Russell Micro Cap Index (NYSEArca: IWC) and the NASDAQ 100 Index (Nasdaq:QQQ). This tells you not only the movement in the overall market but also in the various capitalized levels of the market. These 5 fund own approximately 3000 separate stocks equaling about 98% of the entire US stock market capitalization.
Notice all 5 ETFs are trading below their 20 and 50 day moving averages. If you panic when the market is off by more than 10% then there is good news here as only the Russell Micro Cap is down by more than 10% and the Nasdaq 100 is only 2.94% off its 52 week high.
S&P 500 Large Cap Index
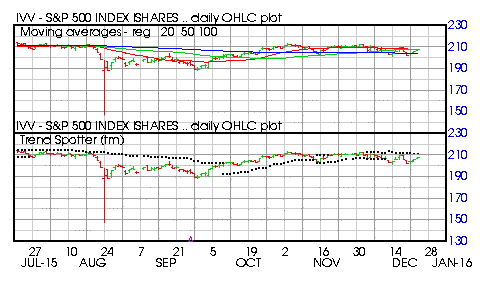
Barchart technical indicators:
- 16% Barchart technical buy signals
- Trend Spotter sell signal
- Below its 20 and 50 day moving averages
- 3.67% off its 52 week high
- Relative Strength Index 50.82%
- Barchart computes a technical support level at 203.01
- Recently traded at 207.49 which is below its 50 day moving average of 207.78
S&P 400 Mid Cap Index
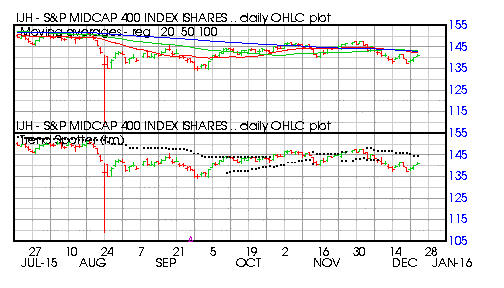
Barchart technical indicators:
- 48% Barchart technical sell signals
- Trend Spotter sell signal
- Below its 20, 50 and 100 day moving averages
- 9.05% off its 52 week high
- Relative Strength Index 47.87%
- Barchart computes a technical support level at 137.44
- Recently traded at 141.24 which is below its 0 day moving average of 143.31
S&P 600 Small Cap Index
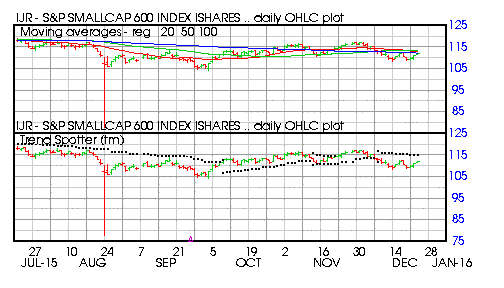
Barchart technical indicators:
- 0% Barchart technical hold signals
- Trend Spotter sell signal
- Below its 20, 50 and 100 day moving averages
- 8.41% off its 52 week high
- Relative Strength Index 48.68%
- Barchart computes a technical support level at 108.60
- Recently traded at 111.94 which is below its 50 day moving average of 113.18
Russell Micro Cap Index
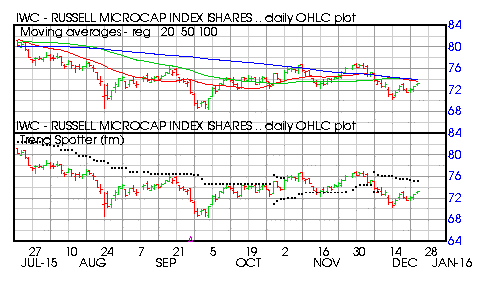
Barchart technical indicators:
- 16% Barchart technical sell signals
- Trend Spotter sell signal
- Below its 20, 50 and 100 day moving averages
- 13.19% off its 52 week high
- Relative Strength Index 49.10%
- Barchart computes a technical support level at 71.45
- Recently traded at 73.15 which is below its 50 day moving average of 74.04
NASDAQ 100
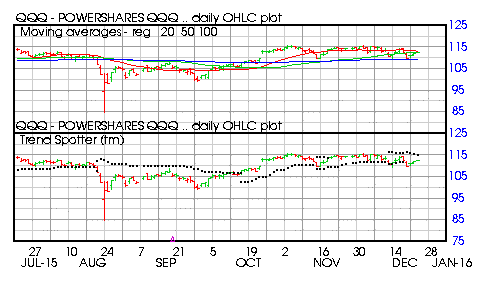
Barchart technical indicators:
- 8% Barchart technical buy signals
- Trend Spotter sell signal
- Below its 20 and 50 day moving averages
- 2.94% off its 52 week high
- Relative Strength Index 49.48%
- Barchart computes a technical support level at 110.70
- Recently traded at 112.29 which is below its 50 day moving average of 112.52



Comments
Log in or sign up to join the conversation.