

MAHINDRA & MAHINDRA – M_M (1D Chart) Elliott Wave Technical Analysis
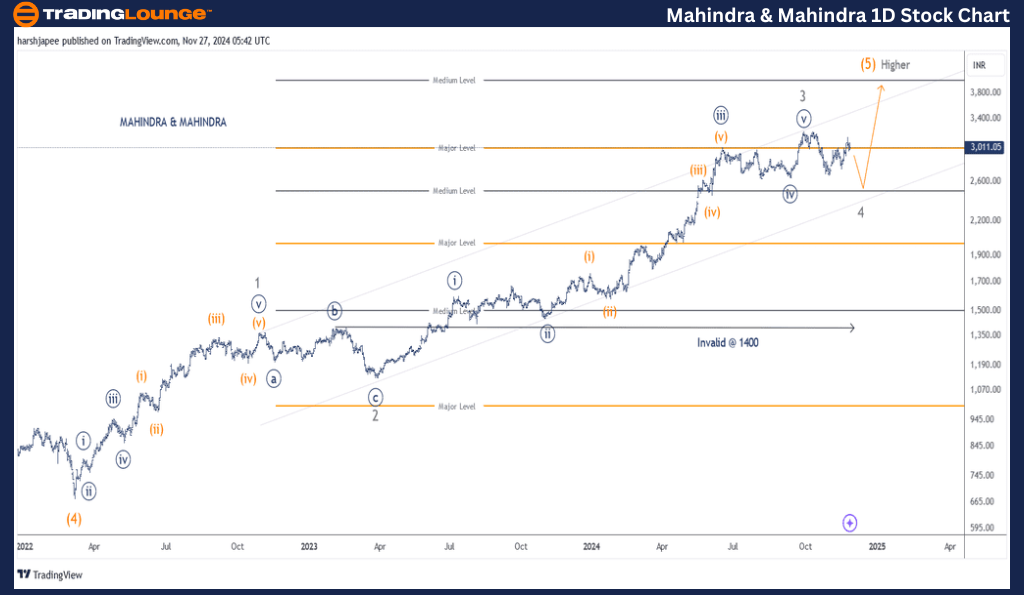
Function: Larger Degree Trend Higher (Intermediate degree, Wave (5) Orange)
Mode: Motive
Structure: Impulse
Position: Minor Wave 4 Grey
Details: Minor Wave 4 Grey might be complete as an expanded flat around 2700-20 range, or could drag to one more low (2500-50), within Intermediate Wave (5) Orange against 1400. If correct, Minor Wave 5 Grey should be underway higher soon.
Invalidation point: 1400
MAHINDRA & MAHINDRA Daily Chart Technical Analysis and potential Elliott Wave Counts:
MAHINDRA & MAHINDRA daily chart is indicating a religious uptrend, which has completed Minor Wave 4 around the 2700 mark or is near to completion around 2500-50 range. The stock could then turn higher again pushing through 3400 levels.
MAHINDRA & MAHINDRA stock prices had dropped through 675 lows in March 2022; carving Intermediate Wave (4) Orange. The subsequent rally thereafter suggests Minor Waves 1, 2 and 3 are complete and Wave 4 is potentially complete around 2700 mark.
If the above proposed structure holds well, the stock could first drop towards 2500-50 range then turn higher to complete Minor Wave 5 above 3400 levels.
MAHINDRA & MAHINDRA – M_M (4H Chart) Elliott Wave Technical Analysis
Function: Larger Degree Trend Higher (Intermediate degree, Wave (5) Orange)
Mode: Motive
Structure: Impulse
Position: Minor Wave 4 Grey
Details: Minor Wave 4 Grey might be complete as an expanded flat around 2700-20 range, or could drag to one more low (2500-50) as a combination of Minute degree, within Intermediate Wave (5) Orange against 1400. If correct, Minor Wave 5 Grey should be underway higher soon.
Invalidation point: 1400
MAHINDRA & MAHINDRA 4H Chart Technical Analysis and potential Elliott Wave Counts:
MAHINDRA & MAHINDRA 4H chart is highlighting the structure between Minor Wave 3 Grey and further. It is possible that Minor Wave 4 unfolded as an expanded flat ((a))-((b))-((c)) and is complete around 2700. Alternatively, Wave 4 could unfold as a combination to drop through 2550 range.
Once the above is complete, the stock is expected to turn higher as Minor Wave 5 begins to unfold against 1400 mark.
.png.22f854977550f9dc08fcd32def9eea77.png)
Conclusion:
HCL TECHNOLOGIES is progressing higher within Minute Wave ((v)) of Minor Wave 5 against 1750 lows.
Elliott Wave Analyst: Harsh Japee
More By This Author:
Unlocking ASX Trading Success - Unibail-Rodamco-Westfield
Elliott Wave Technical Analysis - TASI Index
Elliott Wave Technical Analysis - U.S. Dollar/Japanese Yen - Wednesday, Nov. 27



Comments
Log in or sign up to join the conversation.