

The Roundhill Magnificent Seven ETF (MAGS) is an exchange-traded fund that provides exposure to the seven mega-cap technology stocks known as the Magnificent Seven: Apple, Microsoft, Nvidia, Amazon, Alphabet, Meta, and Tesla. The ETF offers investors a simple way to track the performance of these market-leading companies in a single investment vehicle.
MAGS Weekly Elliott Wave Chart
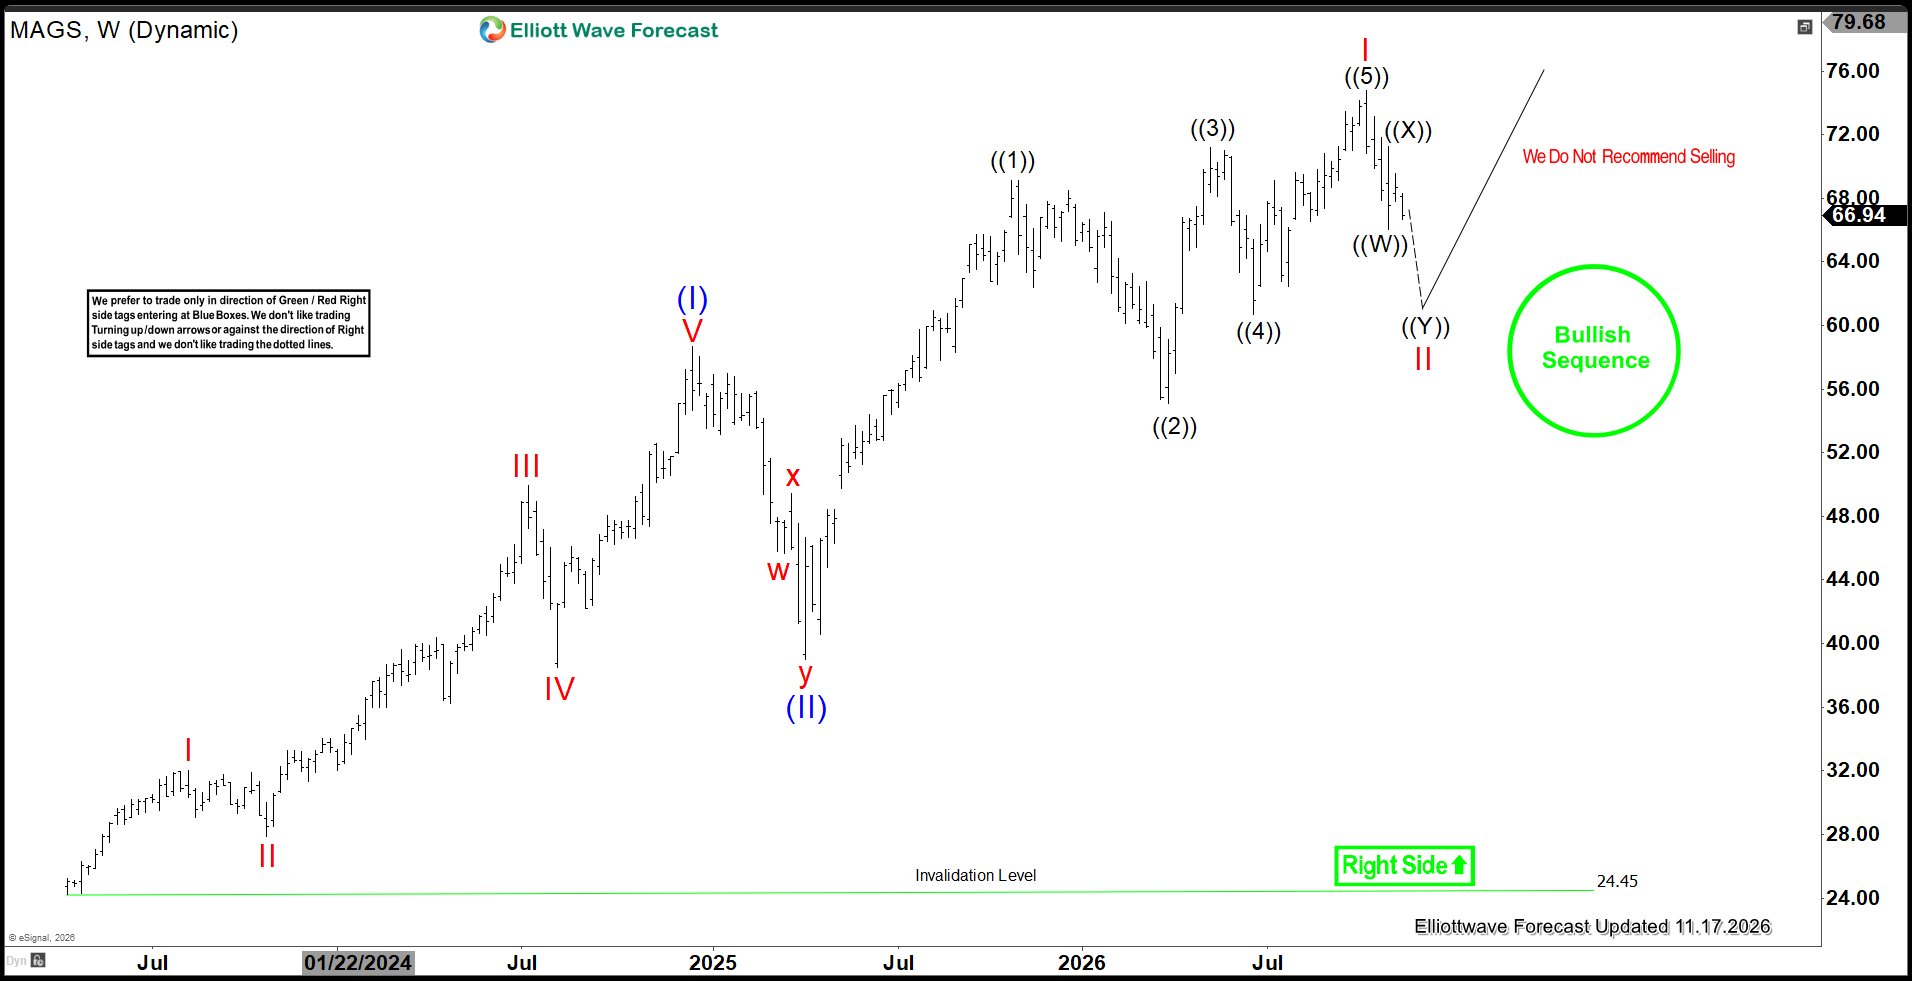
The weekly Elliott Wave analysis of the Magnificent Seven ETF (MAGS) highlights a strong bullish sequence emerging from its all-time low. The initial advance to $58.69 completed Super Cycle wave (I). It was then followed by a corrective decline in Super Cycle wave (II) that found support at $39.00. From that low, the ETF resumed its upward trend and unfolded as a five-swing leading diagonal. The rally ultimately completed Super Cycle wave I at $74.78. This advance also marked the completion of the broader cycle that began from the April 2025 low. With the impulsive structure now complete, Super Cycle wave II has started to develop. The current pullback is expected to correct the entire advance from the April 2025 low and should unfold as a 3-swing or 7-swing corrective structure before buyers re-emerge. As long as the correction remains above the April 2025 low, the larger bullish sequence remains intact, favoring another leg higher once the ongoing corrective phase reaches completion.
MAGS Daily Elliott Wave Chart
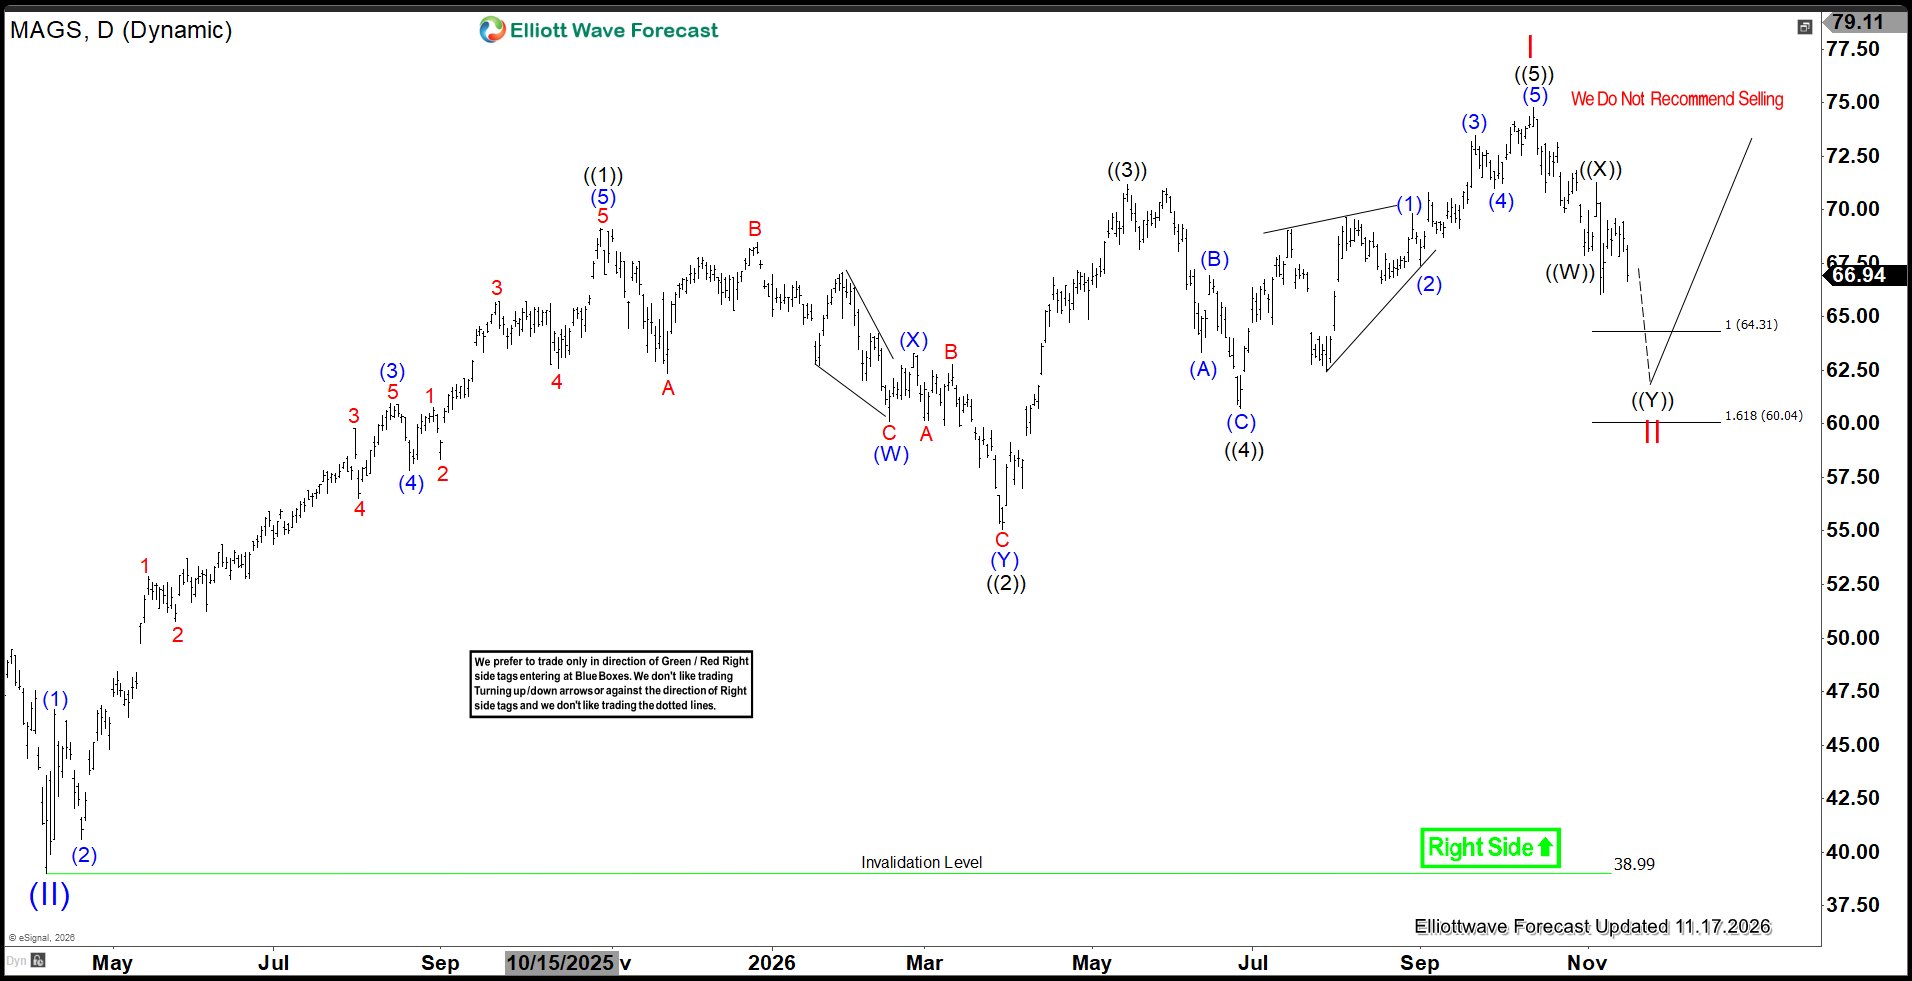
The daily Elliott Wave view of MAGS suggests that the advance from the April 7, 2025 low unfolded as a leading diagonal structure. The entire cycle completed wave I at $74.78. Following the completion of this bullish sequence, a larger-degree pullback in wave II is now expected to unfold. Pullback should correct the advance from the April 2025 low in either a 3-swing or 7-swing corrective structure before the broader uptrend resumes.
The next potential support area comes in at $60.00 - $64.30, where buyers could re-enter the market. Under the more aggressive bullish scenario shown above, wave II completes as a simple three-swing correction from the $74.78 peak. Afterwards, the ETF will resume higher and potentially reach new highs.
However, an alternative scenario remains valid. In this case, the current decline forms part of a larger 7-swing corrective structure. Should this occur, the $60.00 - $64.30 area may only produce a temporary bounce rather than mark the ultimate low. The ETF could then resume its decline and extend the correction in additional swings before completing wave II. Once this larger corrective pattern is finished, the broader bullish sequence from the April 7, 2025 low is expected to reassert itself, favoring another leg higher in the direction of the primary trend.



Comments
Log in or sign up to join the conversation.