
.jpg")
The Magnificent Seven ETF (MAGS) tracks the performance of seven leading U.S. technology and growth companies. It offers investors concentrated exposure to some of the market’s most influential names. Since its launch, MAGS has exhibited strong directional moves that lend themselves well to Elliott Wave analysis. It has clear impulsive advances and corrective phases shaping its medium‑term trend structure.
MAGS Weekly Elliott Wave Chart
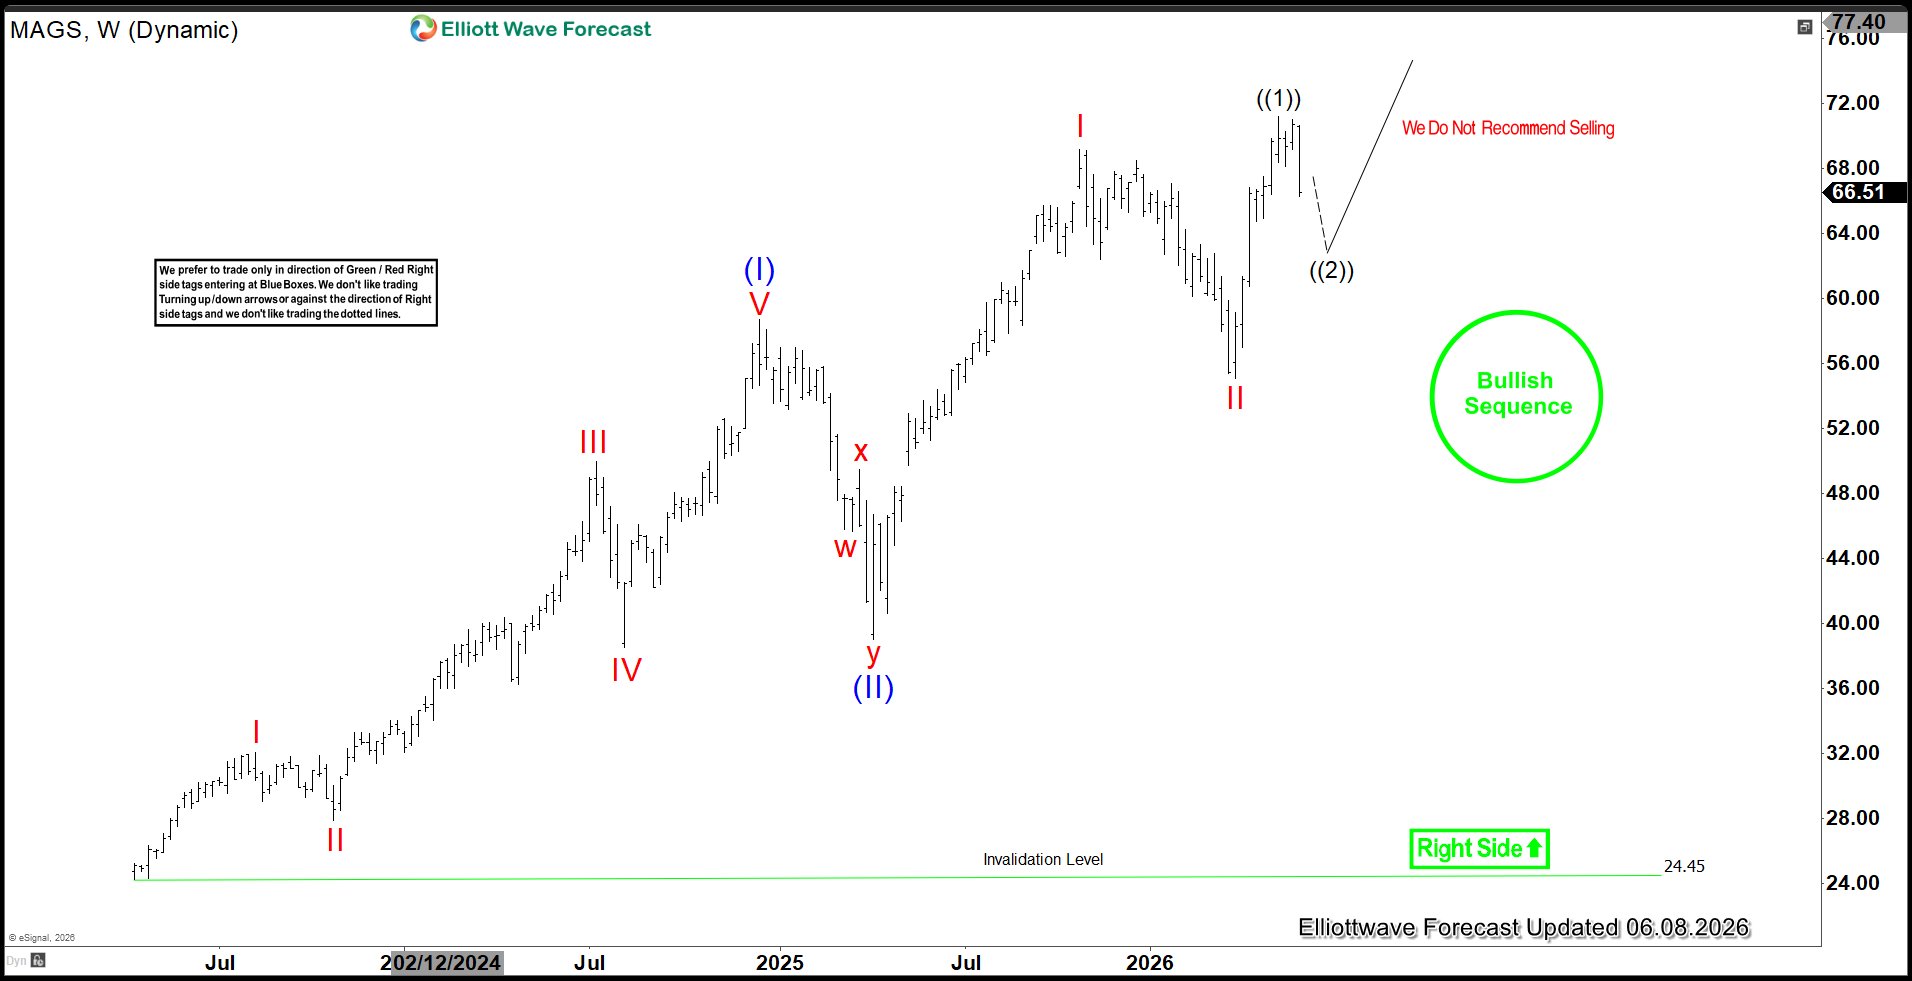
The weekly Elliott Wave view of the Magnificent Seven ETF (MAGS) shows the initial advance from its all‑time low peaking in wave (I) at $58.69 in December 2024, a move shaped by a five‑wave impulse. That rise was followed by a corrective phase, with wave (II) bottoming at $39 in April 2025. From there, the ETF launched into wave (III) as a nested progression, carrying prices to $69.14 to complete wave I. The subsequent decline in wave II found support at $55.09, setting the stage for another leg higher in wave III. Within this advance, wave ((1)) of III topped at $71.16. A pullback in wave ((2)) is now expected, working off the cycle that began from the March 30, 2026 low, before the broader uptrend resumes.
MAGS Daily Elliott Wave Chart
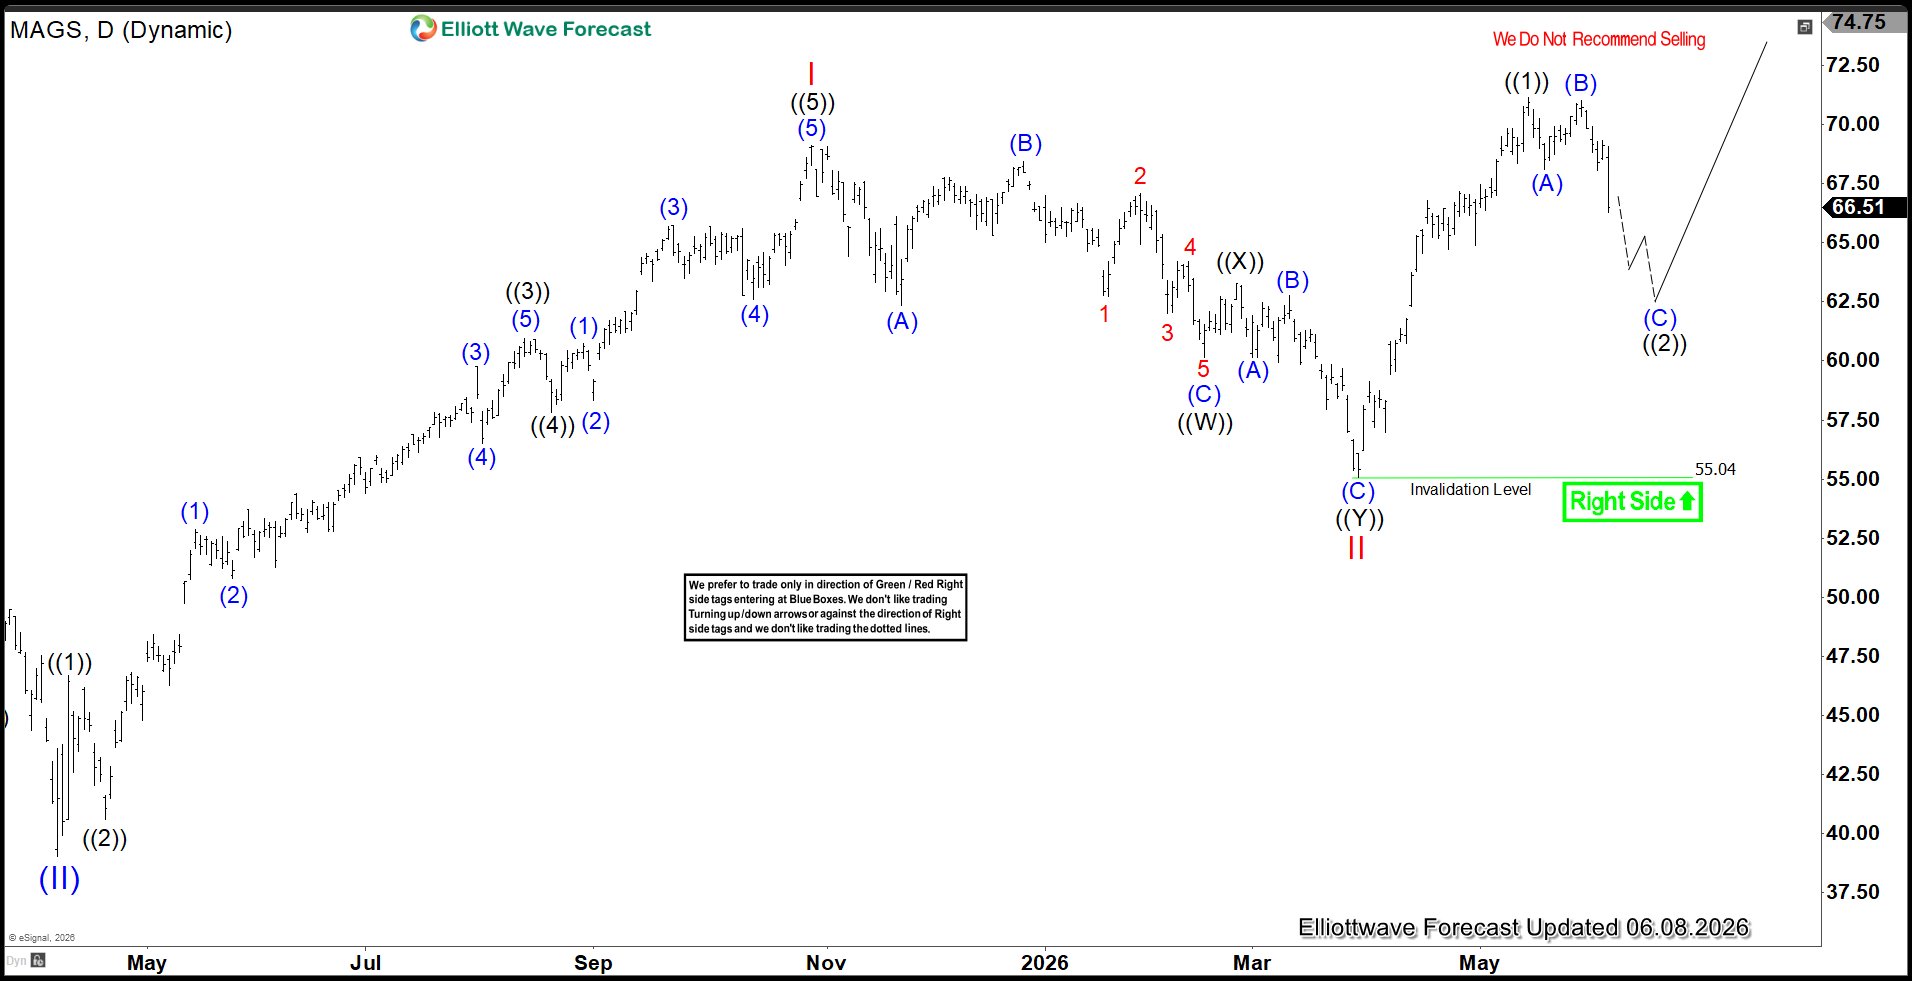
On the daily Elliott Wave chart of the Magnificent Seven ETF (MAGS), the advance from the April 2025 low carried through to wave I at $69.14. The subsequent decline in wave II found support at $55.04, after which the ETF turned higher into wave III. Within this sequence, wave ((1)) of III peaked at $71.16. The current retreat in wave ((2)) of III is unfolding as a flat correction, working off the cycle that began from the March 30, 2026 low, before the broader upward trend resumes.


Comments
Log in or sign up to join the conversation.