
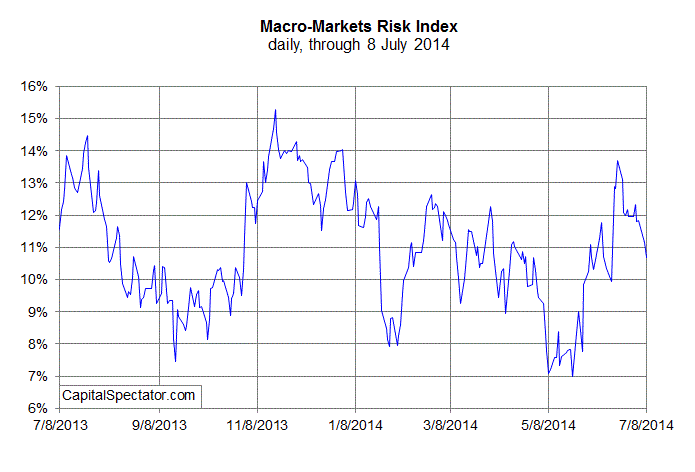
The US economic trend remained positive, settling at an average pace for the year to date through July 8, according to markets-based benchmark. The Macro-Markets Risk Index (MMRI) closed at +10.7% on Wednesday, or just slightly above the average of daily readings so far in 2014. The consistently positive numbers suggest that business cycle risk remains low. A decline below 0% in MMRI would indicate that recession risk is elevated. By comparison, readings above 0% imply that the economy will expand in the near-term future.
MMRI represents a subset of the Economic Trend & Momentum indices (ETI and EMI), a pair of benchmarks that track the economy’s broad trend for signs of major turning points in the business cycle via a diversified set of indicators. (For details about ETI and EMI, see Nowcasting The Business Cycle.) Analyzing the market-price components separately offers a real-time approximation of macro conditions, according to the “wisdom of the crowd.” Why look at market data for insight into economic conditions? Timely signals. Conventional economic reports are published with a time lag. MMRI is intended for use as a supplement for developing perspective on the current month’s economic profile until a complete data set is published.
MMRI measures the daily median change of four indicators based on the following calculations:
• US stocks (S&P 500), 250-trading day % change, plotted daily
• Credit spread (BofA ML US High Yield Master II Option-Adjusted Spread), inverted 250-trading day % change, plotted daily
• Treasury yield curve (10-yr Treasury yield less 3-month T-bill yield), no transformation, plotted daily
• Oil prices (iPath S&P GSCI Crude Oil Total Return Index ETN (OIL)), inverted 250-trading day % change, plotted daily
Here’s how MMRI compares on a daily basis since August 2007:

Here’s a closer review of MMRI for the past 12 months:

Comments
Log in or sign up to join the conversation.