

Point & Figure overview of SPX
Long term trend: The bull market which started in 2009 shows no sign of having run its course. A long count taken on the long term P&F chart gives us a potential target as high as 4080. P&F does not predict time; only price. (no change)
Intermediate trend: If this develops into an intermediate uptrend, the next projection is 3630. This projection will not change if a normal pull-back occurs.
Important cycles
There are an infinite number of cycles of all magnitudes. It is impossible to identify them all. Eric Hadik is the cycle expert and even he does not always predict their influence precisely 100% of the time. I follow only a few cycles which have shown consistency and use them as part of my analysis.
The 20-wk cycle is due on about 2/26
Market Analysis (Charts courtesy of QCharts)
I have added the NYSE Composite Index in order to provide a broader perspective to evaluate “the market”. Since the NYA is the one which contains the most number of stocks, it probably best represents the current market condition. As you can see, the three indices are not in unison. It’s too early to draw conclusions, and perhaps it means nothing since IWM has been diverging from SPX forever, which did not prevent the latter from making new all-time highs. We know that the strongest index is the NDX which influences both the SPX and the DJIA. So, until we see weakness appear in that index, we should not have any major concern.

SPX daily chart
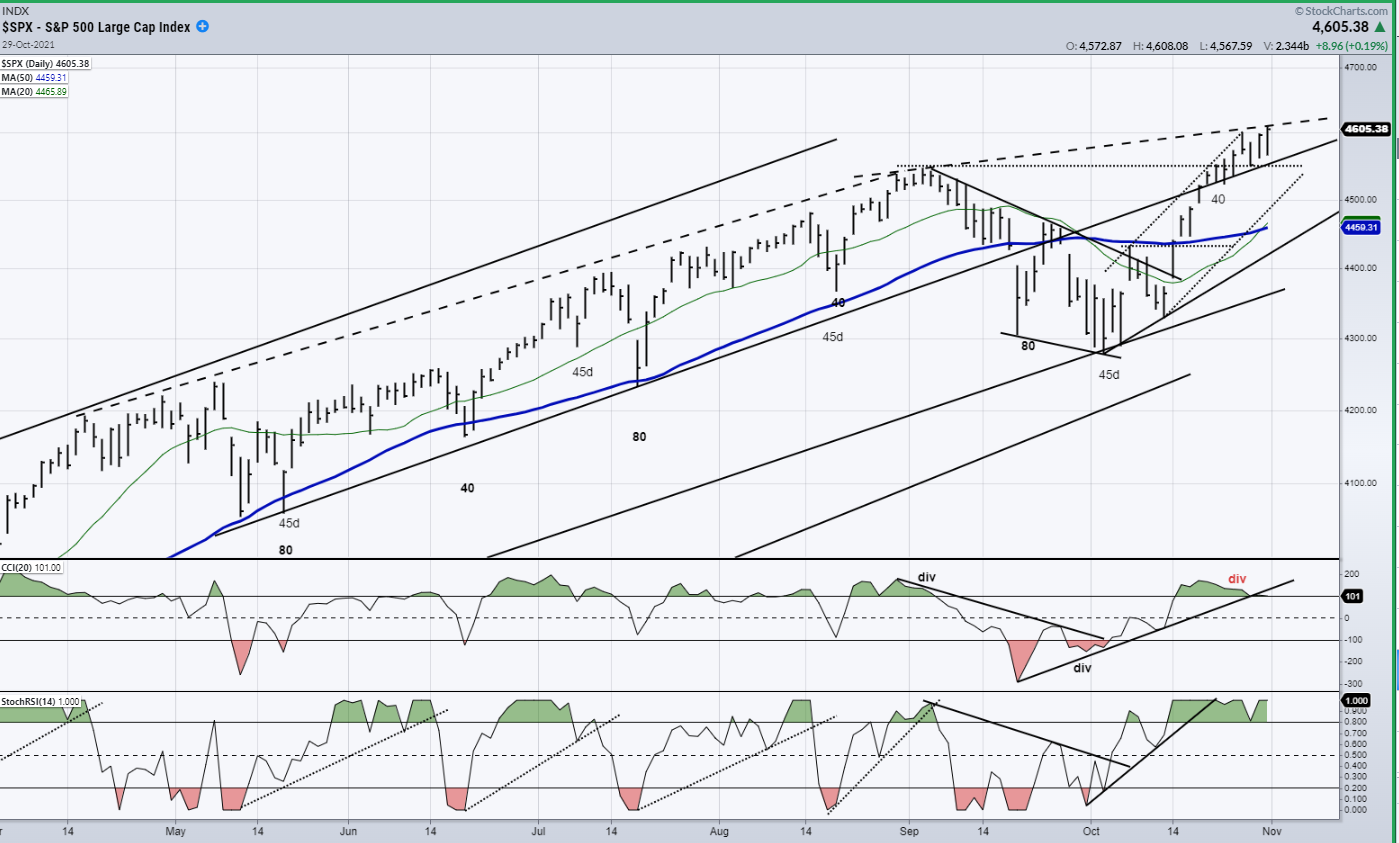
With the assistance of super-strong NDX, the 12-year low drove SPX to a new all-time high. You will note that neither of the two indexes shown above (NYA and IWM) achieved a new high. As mentioned above, that in itself may not be a reason for concern, but if you consider the fact that the oscillators at the bottom of the chart are already showing some negative divergence, it means that while technically, we do have a break-out, it is not a very strong break-out such as the one produced by the NDX which exceeded its previous high by a considerable margin and, in comparison to which the SPX looks much less robust). But the reason for the divergences may be due to the fact that, as I have noted on the chart, the 20-wk cycle low is fast approaching.
Currently, according to the P&F chart, we could expect a retracement of 40 or 50 points. A failure to make a new high after that would suggest that something is not as it should be.

SPX hourly chart
The hourly chart of the SPX does not require much-sophisticated analysis. A quick glance shows that a strong start (due to the beginning of a new 2-yr cycle up-phase) carried the index from 3215 to 3348 in just three days before the first profit-taking pull-back set in. This was followed by another rapid continuation of the bullish trend, but it fizzled quickly into a struggle to keep the trend alive! The trend line has now been broken and little has been accomplished since, giving the index the appearance of topping and being ready to reverse its trend. But first, we’ll have to find out if that little push higher on the close goes anywhere.
If a cycle-induced correction occurs, standard Fibonacci retracement targets could take us down to: 3320 (.382), or 3300 (.50), which generally agrees with the P&F projections.

UUP (dollar ETF)
The short-term moves in UUP appear to be ruled by a 3-mo cycle which looks ready to roll over. It may not be something immediate since there is still no trace of a topping formation, although the oscillators do suggest that a top could be near. If that rhythm persists, it could have some implication for the performance of the following two items.

GDX (gold miners)
GDX has been in a sideways formation for the past two weeks. This appears to denote a waiting game rather than weakness that should have resulted from breaking the green trend line. The oscillators also imply a state of readiness to resume the interrupted uptrend. If so, the P&F chart suggests a quick move ahead to 32.50, followed by an extension to 35. A market correction added to a UUP retracement would be a positive for GDX.

PAAS (Pan American Silver Corp)
A retracement in the dollar, coupled with a short-term correction in SPX could also have bullish implications for PAAS which is making a very bullish-looking consolidation. After a fast 8-point move from 15.50 to 24.00, PAAS quickly got a .382 retracement out of the way and has been forming a re-accumulation base, since. A break-out would take it to 28-29 on its next move. But it must remain above its blue 50-dma.

BNO (U.S. Brent Oil fund)
With an oversupply of oil continuing to increase as a result of concerns about the Coronavirus, there is no good reason for BNO to reverse its downtrend just yet. On the other hand, when it makes a significant reversal, it may signal that these concerns are abating and that the worst is over.

Summary
SPX is making a short-term top which could forecast the beginning of correction into the end of the month and the low of the 20-wk cycle.


Comments
Log in or sign up to join the conversation.