
When a company repurchases stock, it is basically allocating shareholder capital to a very specific investment: its own shares. If done right - and this is not always the case - buybacks can create a lot of value for investors.
The following paragraphs will present a quantitative screener focused on stocks making high-conviction buybacks, meaning companies that repurchased more than 5% of the shares outstanding in the past year. Academic research shows that high-conviction buybacks tend to produce attractive returns for shareholders, and the backtested performance data confirms this thesis.
The main idea is obviously not buying any stock solely because the company is repurchasing stock with conviction, but rather using this screen as a source of ideas for further research.
The Case For High-Conviction Buybacks
A company that repurchases stock is essentially investing in its own shares. If the stock is undervalued and business prospects are solid, then the company is investing its resources in a compelling investment, which makes the bullish case for the stock even more attractive.
Conversely, if the stock is overvalued or the fundamentals are deteriorating, there is no reason to invest in the company in the first place. Buybacks make the investment even worse in this case, since not only is the stock lousy investment to begin with, but the company is also allocating its capital to an investment with mediocre risk and reward potential.
Warren Buffett is one of the world's leading experts on capital allocation, and he believes that buybacks are the best use of capital when the stock is undervalued.
In Buffett's own words:
"When companies with outstanding businesses and comfortable financial positions find their shares selling far below intrinsic value in the marketplace, no alternative action can benefit shareholders as surely as repurchases."
In theory, corporate executives should have a clear view of the company's future, and they should only repurchase stock when the stock is a good investment in terms of risk and reward. But this is not always the case in real life. Many CEOs are too optimistic about the business they are running, and at many times they repurchase stock in order to artificially boost earnings per share. Needless to say, this is clearly detrimental for shareholders.
On the other hand, research data has proven that high-conviction buybacks - meaning buybacks that account for more than 5% of shares outstanding in a year - have a positive impact on investment returns. These high-conviction buybacks are on average conducted at lower valuation levels, and the average stock making a high-conviction buyback tends to outperform the market by 3.3% in the subsequent year.
In other words, management shouldn't always be trusted when making capital allocation decisions, but the data shows that high-conviction buybacks are generally a smart decision that generates attractive returns for shareholders.
Screener Design And Backtested Performance
The screener excludes companies with a market capitalization value below $250 million from the investable universe. This requirement has a negative impact on returns, but it makes sense in order to maintain a minimum floor on company size.
After that, the screener only includes companies that have reduced the number of shares outstanding by over 5% in the past year. From a starting universe of over 6500 stocks, we are left with nearly 305 companies that meet the criteria above. This clearly shows that companies making high-conviction buybacks are not too abundant, even in times when buybacks are much in vogue among executives.
In order to pick just 30 stocks from the group of 305, we are going to select the 30 names with the highest return on investment capital (ROIC) ratio. This is just a matter of opinion, and we can easily make the case that other kinds of indicators could also make sense.
However, the main idea is avoiding companies that are repurchasing stock while also facing a deterioration in the business fundamentals. By selecting the companies with the highest ROIC levels, we are selecting businesses with relatively high quality and profitability levels.
The backtesting starts in January 1999, the portfolio is rebalanced every four weeks, trading expenses are assumed to be 0.2% per transaction and the benchmark is the SPDR S&P 500 (SPY).
Since January 1999, investing in the 30 stocks recommended in the quantitative screener - with information available at the time and no survivorship bias - would have produced annual returns of 15.51% per year. In comparison, the SPDR S&P 500 gained 6.61% annually over the same period. Alpha for the quantitative screener amounts to 9.34% per year.
The total cumulative return was 1965.5% for the screener and 283.8% for the benchmark. This means that a $100,000 investment in the portfolio recommended by the screener would have turned into $2.065 million, and the same amount of capital allocated to the SPDR S&P 500 in 1999 would currently be worth $385,000.
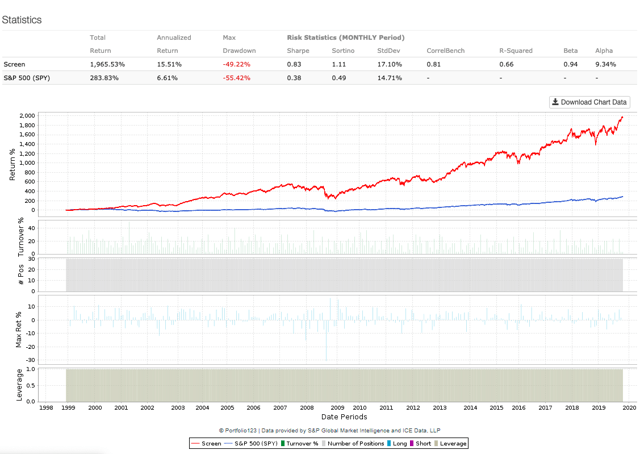
Data from S&P Global via Portfolio123
Providing more details, the table below shows different return and risk metrics for the high-conviction buyback screen versus the SPDR S&P 500.
| Screen | SPY | |
| Annualized | 15.51% | 6.61% |
| Three-Month | 13.37% | 10.07% |
| One-Year | 32.79% | 34.52% |
| Five-Year | 78.36% | 73.19% |
| Total | 1965.53% | 283.83% |
| Sharpe Ratio | 0.8 | 0.38 |
| Sortino Ratio | 1.1 | 0.49 |
| Max Drawdown | -49.22% | -55.42% |
| Standard Deviation | 17.10% | 14.71% |
| Correlation | 0.8 | - |
| R-Squared | 0.7 | - |
| Beta | 0.9 | - |
| Alpha (annualized) | 9.34% | - |
Practical Considerations And Portfolio
It is of utmost importance to keep in mind that the screener is based exclusively on quantitative metrics such as the magnitude of share buybacks and ROIC. There are no qualitative criteria whatsoever included in the portfolio selection.
Variables such as the company's competitive strength and the quality of the management team are just a few obvious examples of qualitative factors that can be remarkably important and should be incorporated into the analysis before buying any of the stocks in the screener.
When it comes to big buybacks, we need to consider the source of the cash flows for those buybacks. It is not the same when the buybacks are fueled by the cash flows produced by the business versus buybacks financed by debt or asset sales. Buybacks founded with internally generated cash flows are much more sustainable over the long term.
In times of historically low interest rates, many companies are issuing debt to repurchase stock. This can be a smart move when considering the cost of debt versus the cost of equity, and tax implications can be particularly favorable in many cases. However, debt issuance also carries some considerable risks for investors when it gets to excessive levels.
As stated above, the screener results should not be interpreted as a list of recommendations, but rather as a source of ideas for further research. Investors should analyze these stocks from multiple perspectives, considering not only the pros and cons of each position but also how each of these stocks would fit into the investor's specific needs and risk tolerance levels.
That being acknowledged, the table below shows the 30 stocks currently recommended by the screener. Data in the table also includes market capitalization in millions and the percentage reduction in the number of shares outstanding over the past year.
| Ticker | Name | MktCap | Shares Change% |
| ABBV | AbbVie Inc. | $131,168 | -5.39% |
| AMP | Ameriprise Financial Inc. | $21,292 | -7.58% |
| AMGN | Amgen Inc. | $142,176 | -9.69% |
| AAPL | Apple Inc. | $1,321,552 | -7.02% |
| EQH | AXA Equitable Holdings Inc. | $11,925 | -8.89% |
| BBX | BBX Capital Corp. | $410 | -5.79% |
| BIIB | Biogen Inc. | $52,906 | -7.32% |
| BKNG | Booking Holdings Inc. | $86,926 | -8.12% |
| BSIG | BrightSphere Investment Group Inc. | $848 | -11.21% |
| CSCO | Cisco Systems Inc. | $201,999 | -8.40% |
| CTXS | Citrix Systems Inc. | $14,524 | -5.88% |
| FANH | Fanhua Inc. | $1,684 | -14.60% |
| FCBC | First Community Bancshares Inc. | $478 | -5.75% |
| GPP | Green Plains Partners LP | $331 | -23.98% |
| JACK | Jack in the Box Inc. | $1,935 | -9.14% |
| LRCX | Lam Research Corp. | $42,692 | -8.29% |
| LAZ | Lazard Ltd. | $4,278 | -6.72% |
| LPLA | LPL Financial Holdings Inc. | $7,510 | -6.17% |
| MAS | Masco Corp. | $13,608 | -5.80% |
| MSCI | MSCI Inc. | $22,087 | -5.96% |
| NVR | NVR Inc. | $13,984 | -5.02% |
| ROK | Rockwell Automation Inc. | $23,445 | -5.72% |
| SBUX | Starbucks Corp. | $105,228 | -11.58% |
| TER | Teradyne Inc. | $11,496 | -8.58% |
| TPRE | Third Point Reinsurance Ltd. | $996 | -8.70% |
| OTCPK:TOGL | Toga Ltd. | $1,271 | -57.45% |
| UI | Ubiquiti Inc. | $12,431 | -7.57% |
| WDR | Waddell & Reed Financial Inc. | $1,168 | -7.98% |
| WAT | Waters Corp. | $15,043 | -9.76% |
| YUM | YUM! Brands Inc. | $30,861 | -5.89% |


Comments
Log in or sign up to join the conversation.