

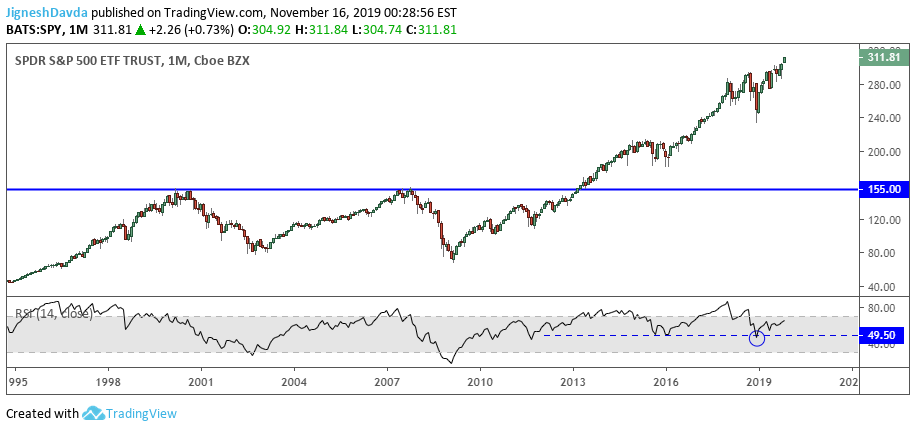
Even if trading equities on shorter time frames, or on an intraday basis, now is the time to zoom out to a monthly outlook to assess exactly what the markets are doing. On a monthly chart of SPY, the index is in a breakout which started about six years ago after it broke above $1550. There have really only been two times where the index lost a bit of momentum.
The first was a correction that began in the summer of 2015 and ended in early 2016. The second was a sharp fall in December last year. To be fair, the correction began in October, but the December price action is what I consider to be significant. I say this because the index was the most oversold during that period when looking back at the last four years.
Why the Emphasis on Technicals
Although I do focus a lot on technical analysis, I certainly don't ignore the fundamentals. But, having said that, I think there is a time to respect price action and what the technical picture is telling us. When an instrument is in a multi-year breakout, it is definitely time to respect the price action.
Keep in mind also, an investor might have a sound fundamental reason to be bearish equities but it could take months or even years before the markets react. As John Mayard once said - "The markets can remain irrational longer than you can remain solvent."
For these reasons, this article is focused on the technical outlook and what price action is saying rather than relying on fundamental analysis.
I'd also like to add, that the fundamental picture can change rather quickly. After all, it was only six weeks ago when headlines were filled with talks of a recession and the implications of an inverted yield curve.
Correlations in Global Equity Indices
What's made me bullish equities a bit early on in the current rally is how strong equities are around the world, generally speaking. There have been a few times over the past four years where several indices entered into a correlated bear market while US equities showed very little signs of weakness. When many of the equity indices around the world are showing strength, I believe it gives that much more of a reason to be bullish US equities. After all, the US markets have long been outperforming their global counterparts.
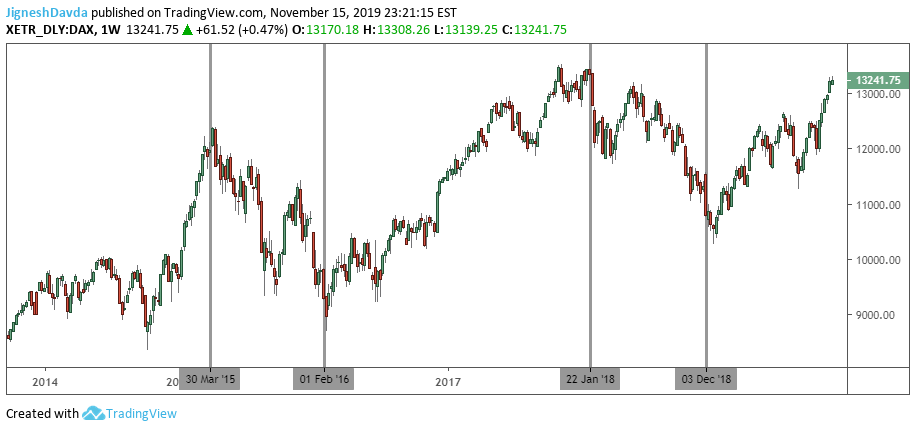
Take a look at the German DAX for example. The chart below shows that this market entered into a notable correction from March 2015 to February 2016 and then once again for pretty much all of 2018. Over the last four years, the gains in the index occurred between February 2016 and January 2018.
If we overlay SPX on this same chart we can see a correlated performance during that same period.
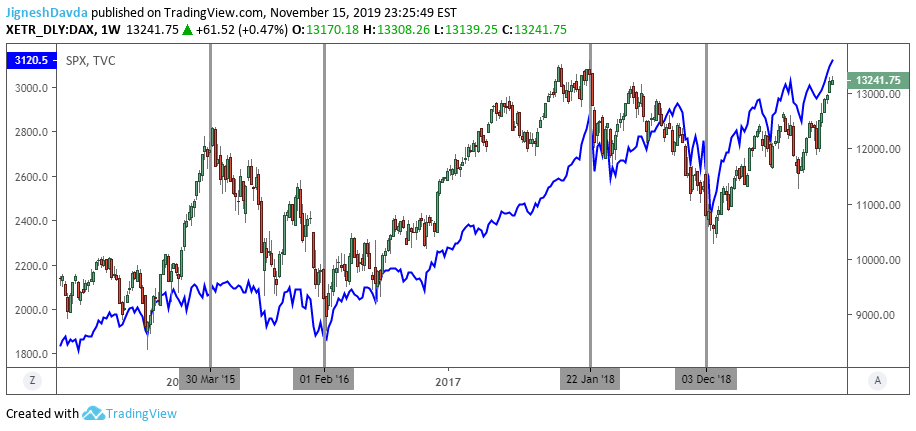
You might be saying "Okay, they have a decent correlation, why is this important?" Well, the technicals differ between the two charts and often send conflicting signals.
Take for example the price action in SPX during the summer. The index rallied for six weeks starting June to break to record highs. It then turned sharply lower to give back much of this gain. So an argument could be made that the S&P 500 will do the same thing again this time around.
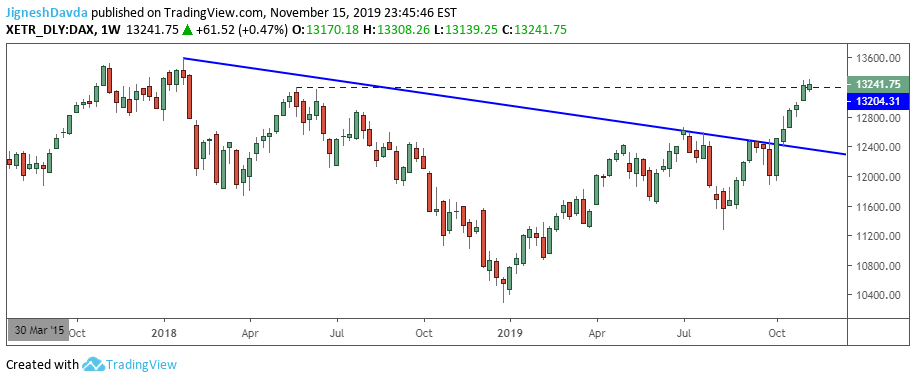
But looking at the technical outlook for the German DAX shows something different altogether. The high posted over the summer was still a fair distance away from the 2018 high. At that time, it would have been difficult to say with conviction that the correction that began at the start of 2018 had completed. Now that we've crossed above the 2018 high, it is much easier to take the view that the correction has ended and that the index has returned within the broader multi-decade bull trend. Further, the index has now posted a succession of higher highs and higher lows when looking at the peak printed in July and the low posted in August.
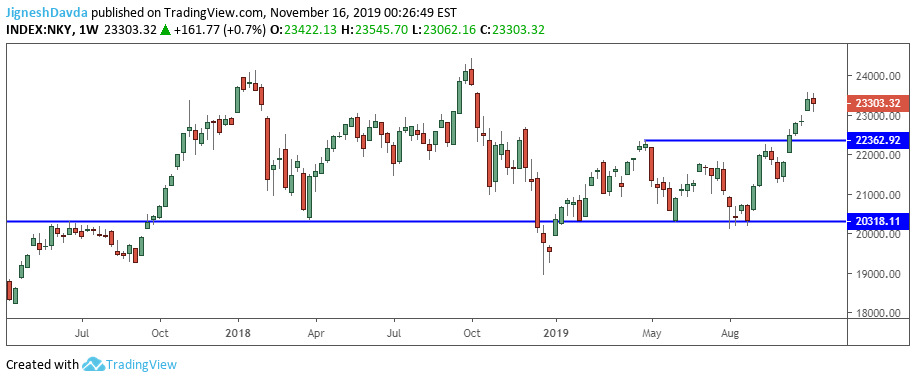
Speaking of higher highs and higher lows, the Japanese Nikkei shows the same thing. This is an index that has been in a bullish trend since 2009 and just broke to fresh yearly highs. In the middle of October, the Nikkei 225 rallied above the April high to post a succession of higher highs and higher lows. I tend to pay a lot of attention to this pattern when a strong trend is in place.
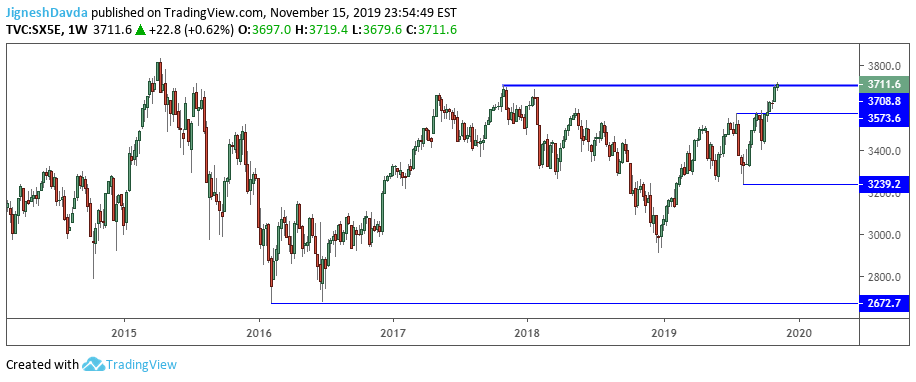
If you also pay a lot of attention to the same pattern, you'll like what's happening in the Euro Stoxx 50. This is an index that recently broke to new yearly highs in October and just printed a fresh four year high this past week.
The bullish signals that these indices are sending leads me to believe that this might just be the start of a bigger move in the US markets. However, there a few indices that do not show a strong bullish signal.
One that stands out is the FTSE 100. This index that has consolidated sideways for most of the year. I suspect that Brexit and a slowing of business investment has a part to play in this. Another one is the Spanish IBEX, although it has been an underperformer for quite some time.
Indices in Asia are generally the weakest of the bunch. The Australian and New Zealand indices are quite strong and near or at record highs. India's Nifty index is near record highs, aided by a weaker Rupee in the second half of the year.
Bottom Line
Looking at the broader picture, I think there is little reason to take a bearish stance on equities. From time to time I have friends and family ask me if now is a good time to short equities. I usually tell them to take a look at a monthly chart of SPY and contract it as much as possible.
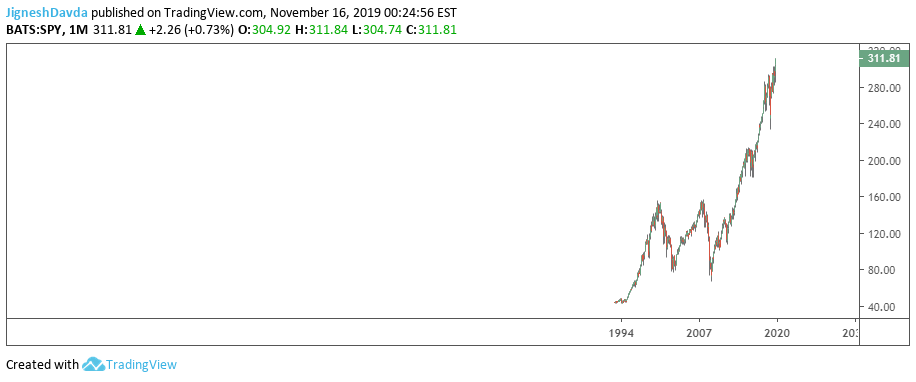
The above chart is what it yields. For the last twenty years, aside from a bit of noise, it's pretty much a straight line up. So my answer obviously is that it's not a good time to short equities regardless of when this question is asked.
I learned a few years back, the hard way, that the path of least resistance in equities is to the upside. But more so when the global markets are signalling the same thing which is certainly the way I see the markets now.
Can the markets correct a few points lower? Sure, of course. But when I see an analyst call for a crash or a bear market it puzzles me each and every time. Mostly because I'm looking at the above chart and respecting what the price action is telling me.


Comments
Log in or sign up to join the conversation.