

Litecoin (LTCUSD) has followed our Elliott Wave roadmap closely over the past several weeks, validating the bearish outlook outlined in mid-May.
On May 15, we highlighted the final stages of wave "c" within an abc corrective pattern forming wave 4. At the time, our analysis suggested that the recovery could complete around the key $60 resistance area before sellers regained control.
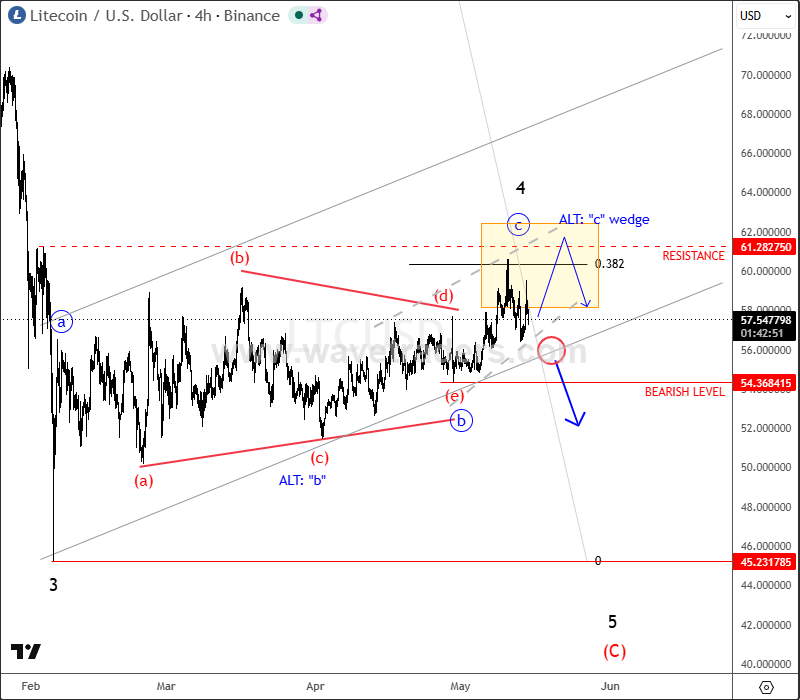
LTCUSD 4H Chart From May 15
Just three days later, on May 18, Litecoin delivered a strong bearish reversal from the projected resistance zone. The decline pushed price back below the rising channel support line and beneath the $54 level, providing confirmation that the abc corrective wave 4 had likely ended and that wave 5 to the downside was underway.
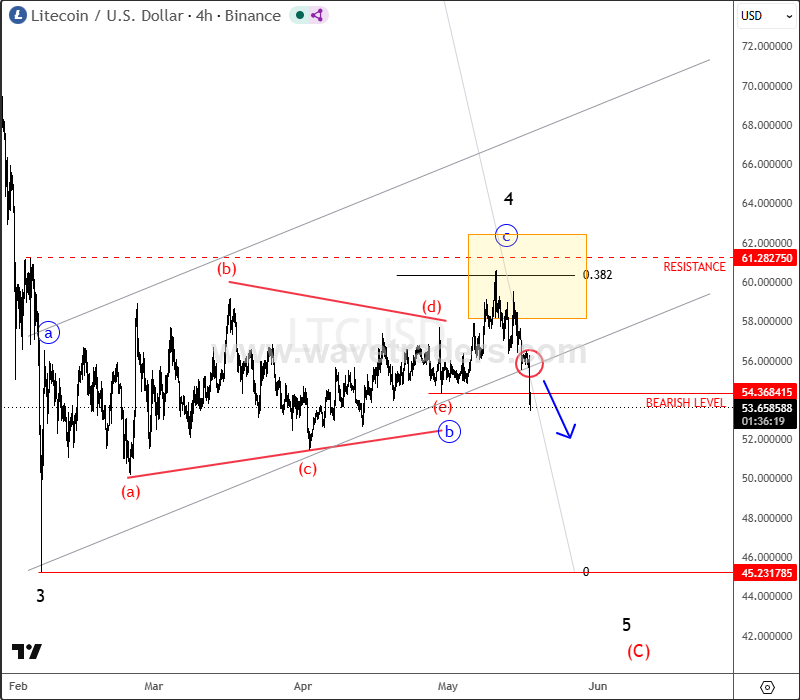
LTCUSD 4H Chart From May 18
Fast forward to June 5, and Litecoin has already fallen sharply and impulsively back to its February lows as wave 5 continues to develop. The bearish structure remains intact while price trades below the key $50 invalidation level.
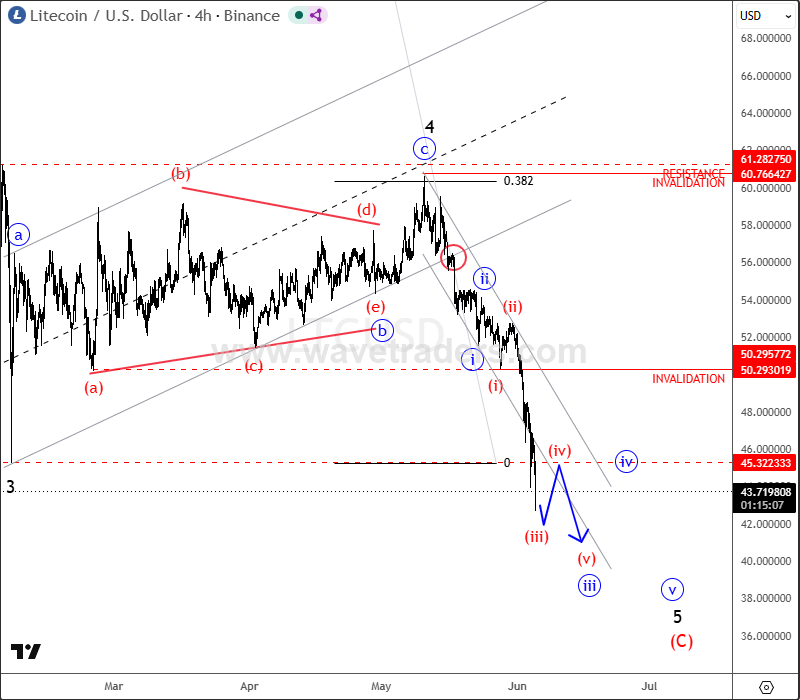
LTCUSD 4H Chart From June 05
From an Elliott Wave perspective, there is still room for additional weakness as a lower-degree five-wave bearish impulse appears incomplete. As long as Litecoin remains below $50, sellers could maintain control and drive the market toward the next major downside target around the $40 area before a larger corrective recovery can emerge.
The price action since mid-May serves as another example of how identifying the completion of corrective wave structures can provide valuable insight into the direction of the next impulsive move.


Comments
Log in or sign up to join the conversation.