

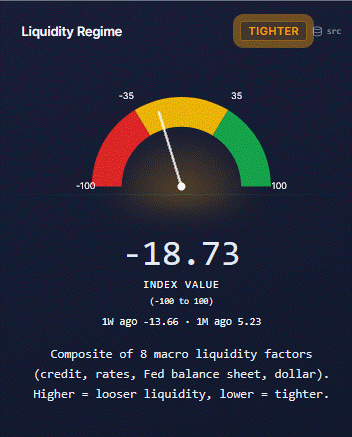
In our new version of SimpleVisor, we added a liquidity gauge. The algorithm behind the gauge uses credit spreads, overnight borrowing conditions, bank reserves, the Fed balance sheet, and dollar and yield trends and volatility. The model provides a quick, easy way to gauge liquidity and determine whether it’s tightening or loosening. Because all assets sit on a foundation of liquidity, it’s important to watch this gauge more closely when it weakens, as it is.
As the gauge below shows, the current reading of -18.73 is still in average territory, but prior readings from one week (-13.66) and one month ago (+5.23) show liquidity is tightening. The recent tightening seems to be largely driven by the financial system’s plumbing. In particular, two inputs are driving it:
Bank reserves have fallen to roughly $2.9 trillion, below the Fed’s $3 trillion LCLoR (Lowest Comfortable Level of Reserves), which is about 1.5 standard deviations below their three-year norm. Reserves support banking lending activity; thus, reserves are a key measure of banks’ ability to provide liquidity to the economy and financial system.
Overnight funding is becoming restrictive. The overnight collateralized borrowing rate (SOFR) has recently been trading 7-10bps above the effective Fed Funds rate. When collateral-backed borrowing costs more than the unsecured policy rate, it is an early omen of funding pressure. The SOFR- Fed Funds spread is more than a standard deviation tighter than its three-year average and rising.
Encouragingly, the market-related stress indicators in our gauge remain calm, although that may be changing with recent equity volatility. Investment-grade credit spreads are near average, though slowly rising. Bond market volatility is running below its three-year average, and dollar volatility is only modestly above it. Lower bond yields are helping improve liquidity. For now, the liquidity gauge is still in normal territory, not panic. But reserves and funding are usually where trouble appears first. This missive is not a flashing red siren, but a reminder of how important liquidity is to asset prices.
What To Watch Today
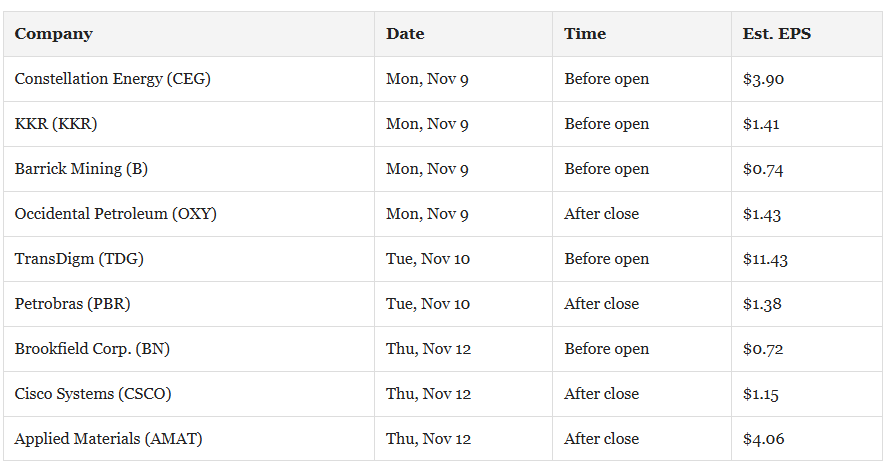
Earnings
Economy
Market Trading Update
Thursday did real technical damage. The S&P 500 closed Friday at 7,376.86, below its 20-day (7,658), 50-day (7,679), and 100-day (7,619) moving averages. It’s holding just 0.7% above the 200-day average at 7,325. The 14-day RSI sits at 35 after touching 33.5 on Thursday, and MACD has rolled into a sell signal at −61 points against a signal line of −27.
Here’s where the “buy the dip” crowd has a point. Thursday’s close sat 3.1 standard deviations below the 20-day average, an extreme that rarely lasts. In Friday’s commentary, we found 27 prior cases since 1950 when the index stretched this far below its 20-day while holding above its 200-day. One month later, it was 23 times higher, with a median gain of 2.4%. Oversold readings with an intact 200-day average have historically produced a bounce rather than a crash.
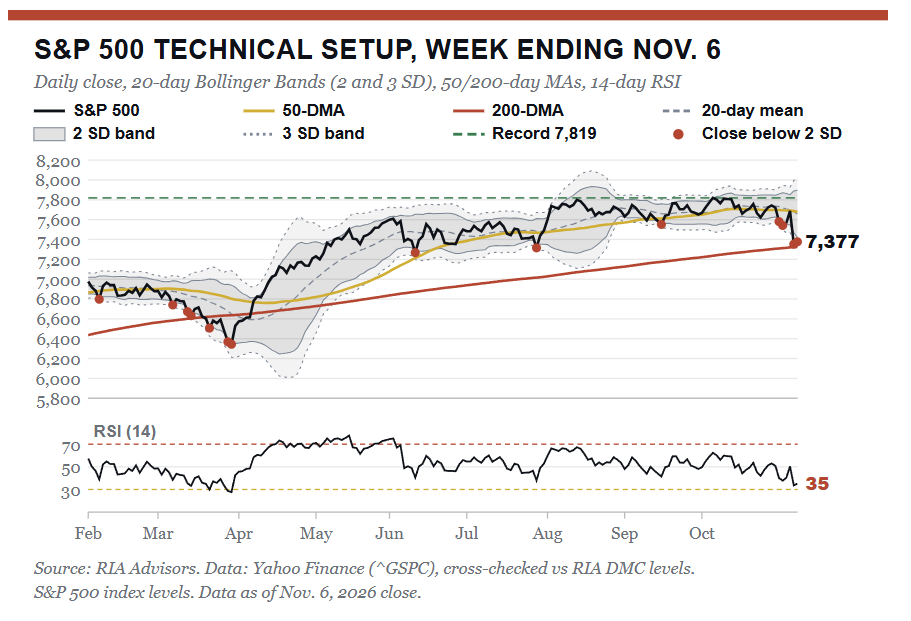
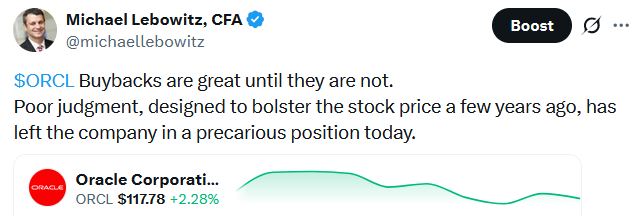
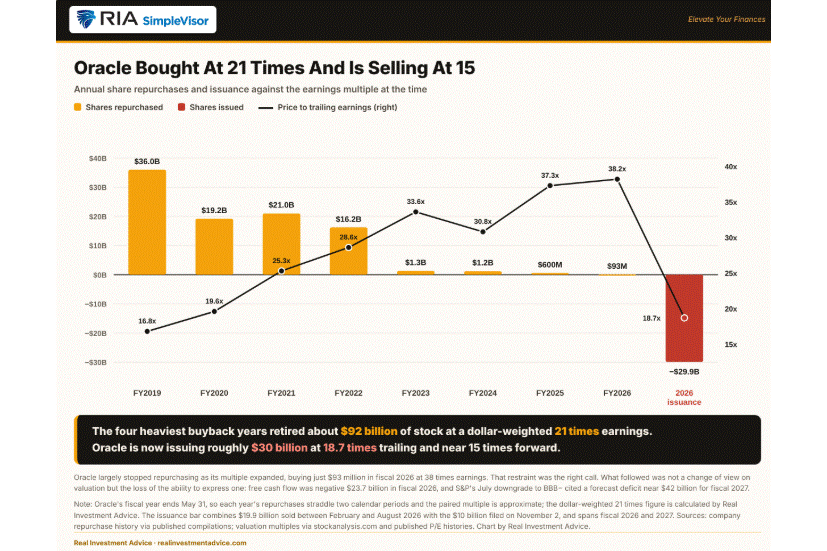
The problem is that our own rules have already spoken. Last Monday, we said a close below 7,490 meant tightening stops and raising cash. Then, on Wednesday, in Oracle Sells Cheap Stock As Its Debt Window Narrows, we said that a decisive close below $169 in the technology ETF (XLK) would have prompted us to step aside from new tech buying. XLK closed Friday at $164.74, 3.2% below its own 200-day average. While both triggers fired, that doesn’t mean we are selling everything. It means the growth tranches we laid out last week are on hold until the trend repairs.
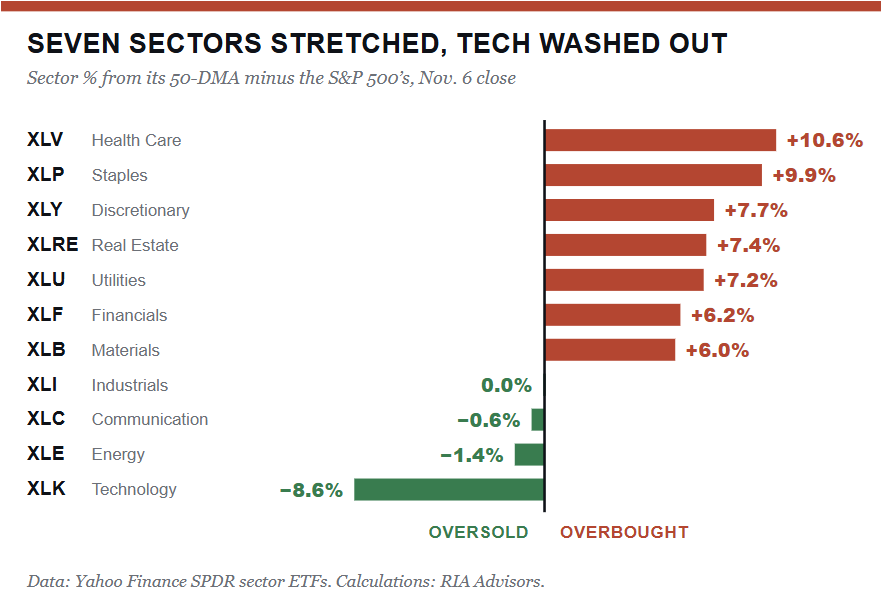
Sector breadth explains why the index held up as well as it did. Seven of eleven sectors are trading well above their 50-day averages relative to the S&P 500, led by Health Care (10.6 points), Staples (9.9), and Discretionary (7.7). Technology sits 8.6 points below with an RSI of 29, and semiconductors are 18% under their 50-day.
As we discussed Thursday in The Election Aftermath: Let The Market Finish Voting, Health Care is more than 15% above its 200-day average, a stretch seen only twice since 2005. The defensive trade is now as crowded as tech was in October. That cuts both ways. Oversold tech is where any rebound has to come from, while stretched defensives are where the next round of selling may start.
Friday’s action is the near-term tell. The index opened near 7,378, rallied to 7,444, and gave it all back into the close. Sellers are still leaning on every bounce. Use any rally toward the 7,620 to 7,680 cluster, where the 100-, 20-, and 50-day averages converge, to trim laggards, rebalance the defensive winners that have run too far, and rebuild cash. Hold core positions at target weights, but stop adding. If the 200-day holds and semiconductors reverse, the tranches resume. A decisive close below 7,316, July’s swing low, opens the door to 7,200 and would shift us toward the 2018 playbook of raising cash and hedging.
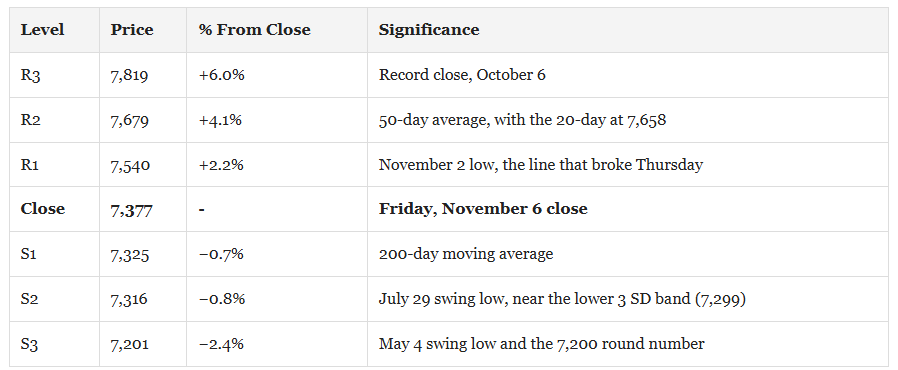
The level that matters most next week is the 200-day average at 7,325. Hold it, and this looks like a violent correction inside a bull market. Lose it, and the conversation changes from “how high” to “how much cash.”
The Week Ahead And Employment
October payrolls rose 165,000, nearly triple expectations, with private jobs accounting for 159,000 of the gain. The unemployment rate fell to 4.1% while participation rose to 61.9%. Average hourly earnings firmed to 0.4% on the month. The only discouraging part of the report is the U6 unemployment rate. The U6 captures discouraged workers and those working part-time because they cannot find full-time work. The rate rose from 7.6% to 7.9%. Last Friday’s employment report argues for a December hike.
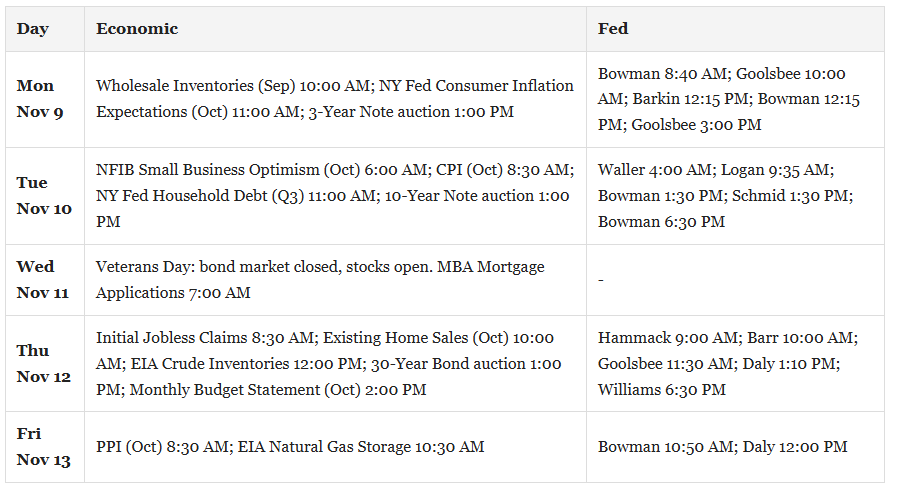
Following closely on the heels of last week’s employment update, the BLS will release CPI on Tuesday and PPI on Friday. Updated inflation will be critical for the Fed, but bear in mind they will get one more employment report and should have good insight into the December CPI report that comes out the day after the Fed’s FOMC meeting. The recent drop in energy prices is unlikely to show up in this week’s data but should appear in the December reports.
The rest of the week is quiet. The bond market will close on Wednesday for Veterans Day, while equities stay open. Accordingly, volumes are likely to be light that day.
Earnings slow as third-quarter season winds down. Applied Materials reports Thursday. As the largest supplier of semiconductor manufacturing equipment, its order book can tell us a lot about the AI buildout.
PPI vs CPI: Are Record Profit Margins About To Get Squeezed?
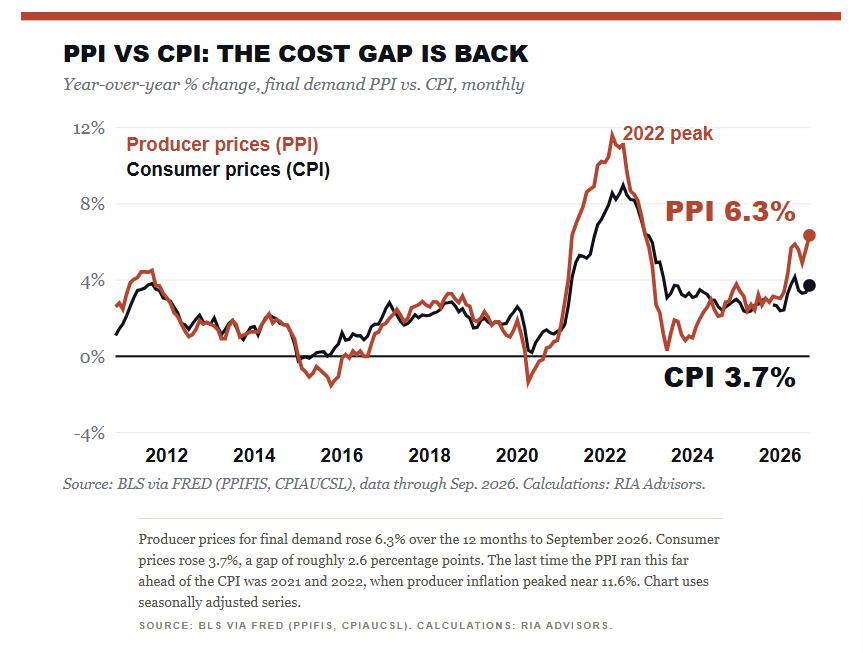
Most investors treat the two reports as interchangeable “inflation” readings. They aren’t. The CPI measures what households pay at the register. The PPI measures what businesses receive for their output, and its intermediate stages measure what they pay for inputs. In other words, the PPI is the cost side of the income statement. For any company selling to consumers, the CPI is the revenue side.
That distinction matters because margins live in the space between them. When producer prices rise faster than consumer prices, someone in the chain is absorbing the difference. Sometimes it’s a wholesaler. Often it’s the company at the end of the line, the one selling to a household that just watched its gasoline bill jump and its real paycheck shrink, that can’t push the higher price through without losing the sale. A widening PPI vs CPI gap is a margin signal first and an inflation signal second.
Tweet of the Day


Comments
Log in or sign up to join the conversation.