

Summary
- The 2020 TCB Model started to fall as the historical models suggest, providing one clue that yields may have peaked last night, and will decline over two weeks at least.
- Falling yields will likely impact equities (usually) with a 2 to 3 day lag. Therefore, falling TCB and falling yields should start to be felt by equities by mid-next week.
- Therefore, even if we expect yields to start trending lower, there should still be two trading days (on average) when equities are still trending higher.
- Total Issuance drives the amount of Treasury Cash Balance creation. In most times the rise of TCB diminishes Bank Reserves (it is the yin and yang relationship of an asset (BRS) vs Liability (TCB) -- It is Total Issuance which is driving both TCB and Bank Reserves (in its inverse).
- The 10yr yield responds directly to Total Issuance but with a lag of several weeks, about three weeks on average (plus or minus 2 weeks).When Issuance rises, TCB rises and BRs falls with a lag of about one week (plus or minus 2 days).
-----------------------------------------------------------------------------------------------
During the first TEN months of 2020, PAM delivered phenomenal real-dollar trading performance, the best at Seeking Alpha:
PAM's flagship Swing Portfolio, year-to-date (October 31) delivered $103, 997, 327.54 profit on $2,172,813 capital. Year-to-date performance: 4,686.29%, on 787-83 win-loss trades. Year to date 2020 spreadsheet here.
Two other PAM funds: Algo Portfolio and Seasonal Portfolio (private) year-to-date (October 31) delivered even better performances.
More details on the SWING PORTFOLIO October 2020 performance here.
SWING PORTFOLIO's September 2020 performance here.
---------------------------------------------------------------------------------.--------------
DECEMBER 6 to December 9, 2020
robert.p.balanModeratorLeaderOwnerDec 6, 2020 7:36 PM
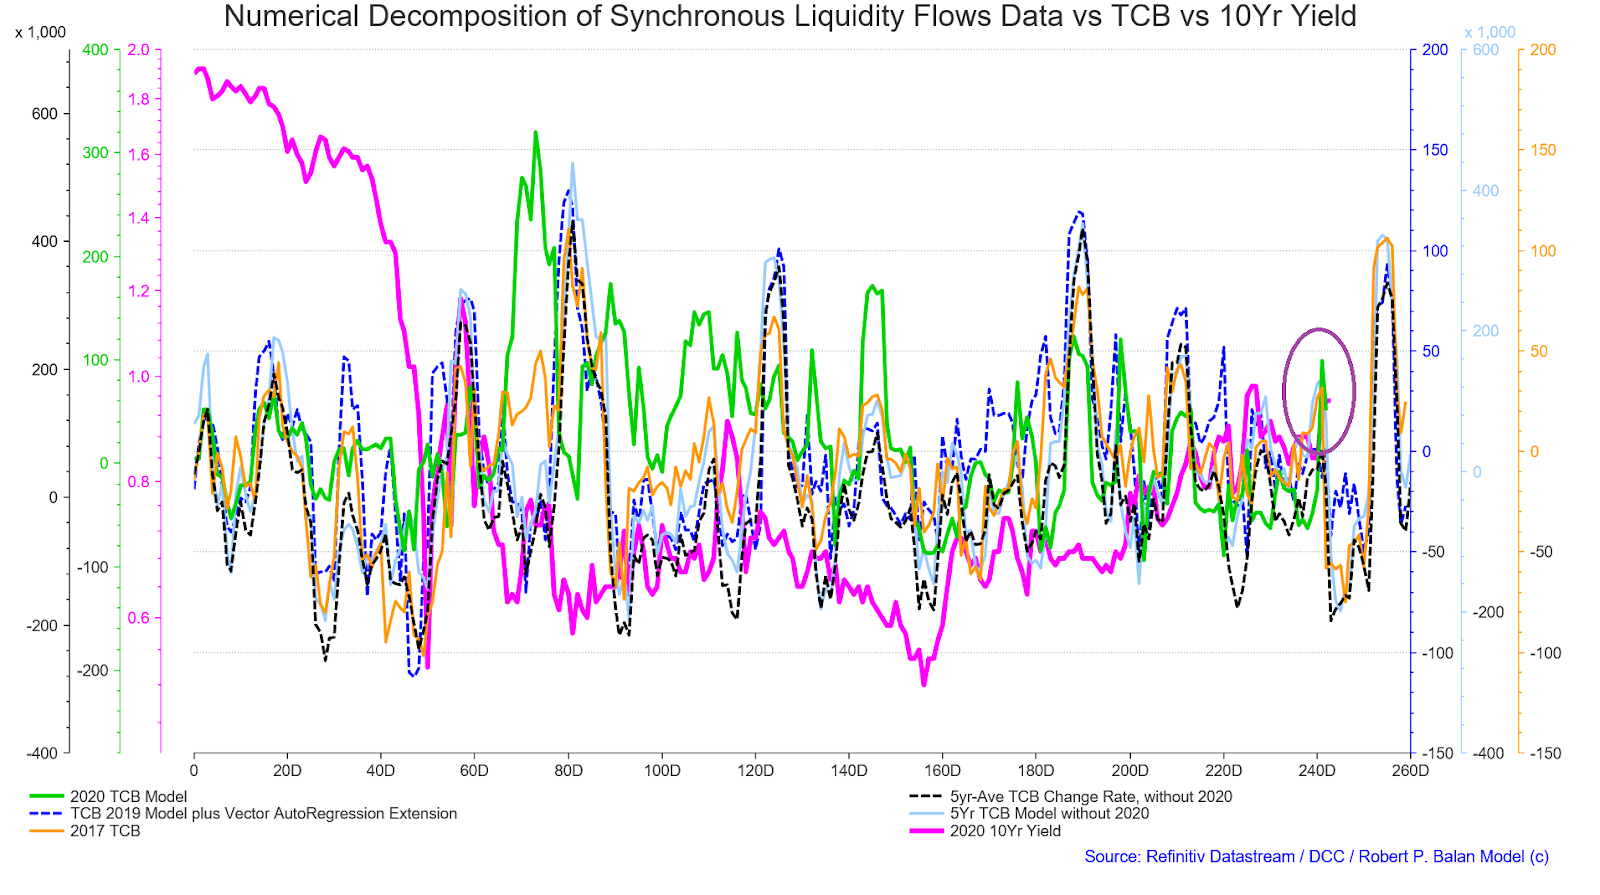
On Thursday, December 3, I provided two charts of the models.
Liquidity Flows, the TCB, and the 10yr yield
 Liquidity Flows, Bank Reserves, and the SPX
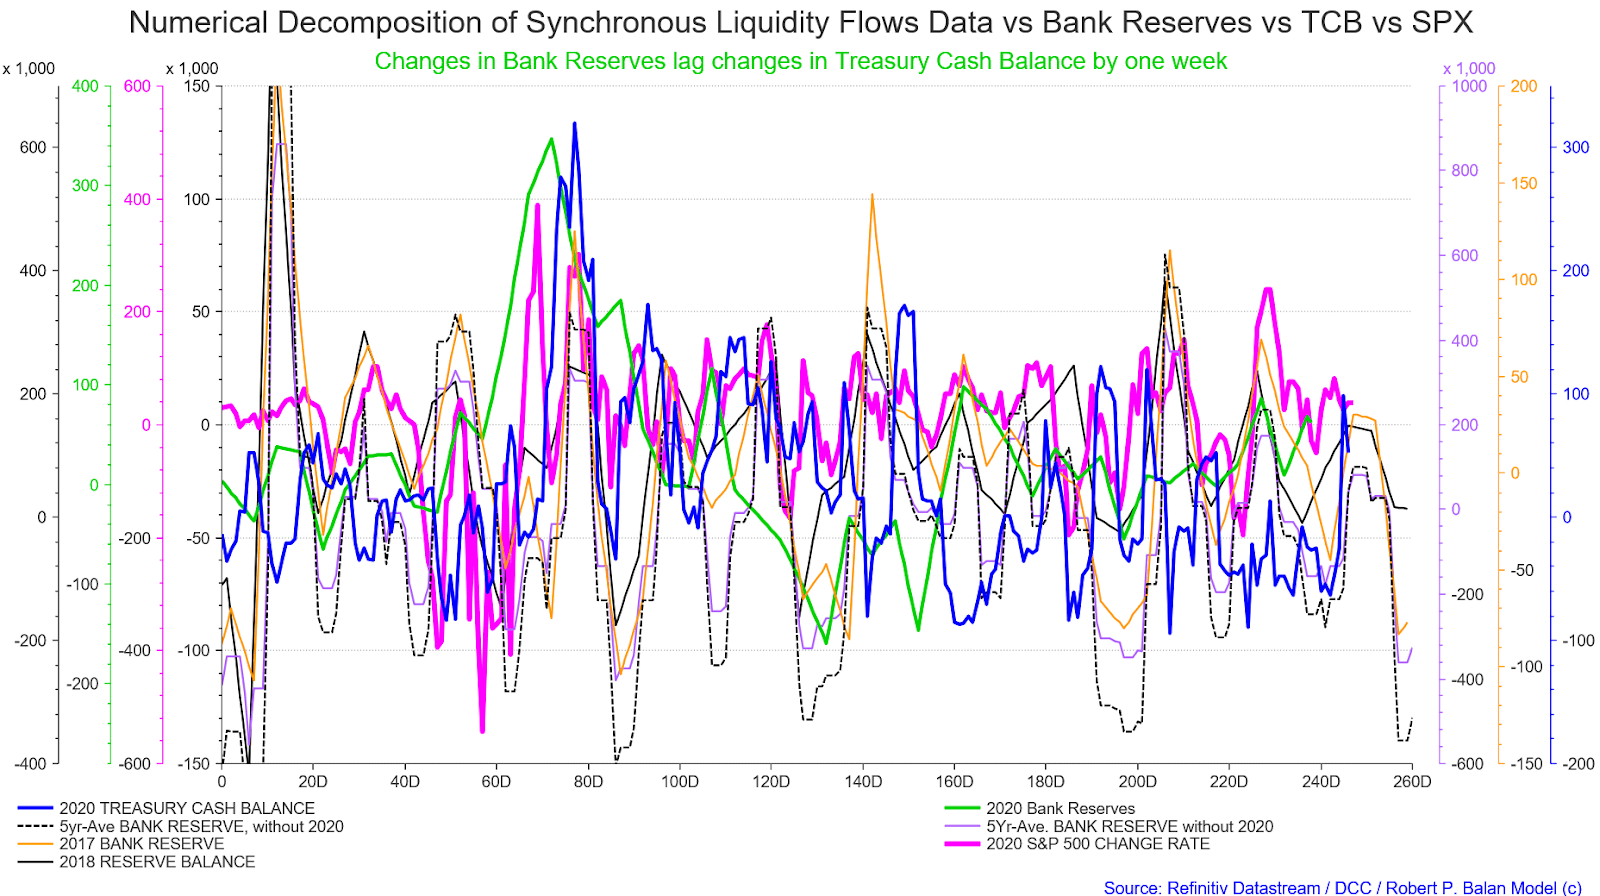
*This was the narrative accompanying those charts,*
_The 2020 TCB Model has started to fall as the historical models suggest, providing one clue that yields may have peaked last night._
_There is also profound (signaling) impact of falling TCB as one measure of liquidity flows. Falling yields will likely impact equities (usually) with a 2 to 3 day lag. Thereby, falling TCB and falling yields should start to be felt by equities by mid-next week._
_Therefore, even if we expect yields to start trending lower, there should still be two trading days (on average) when equities are still trending higher. We might yet get out of those long equity scalpers, hopefully with some profits._
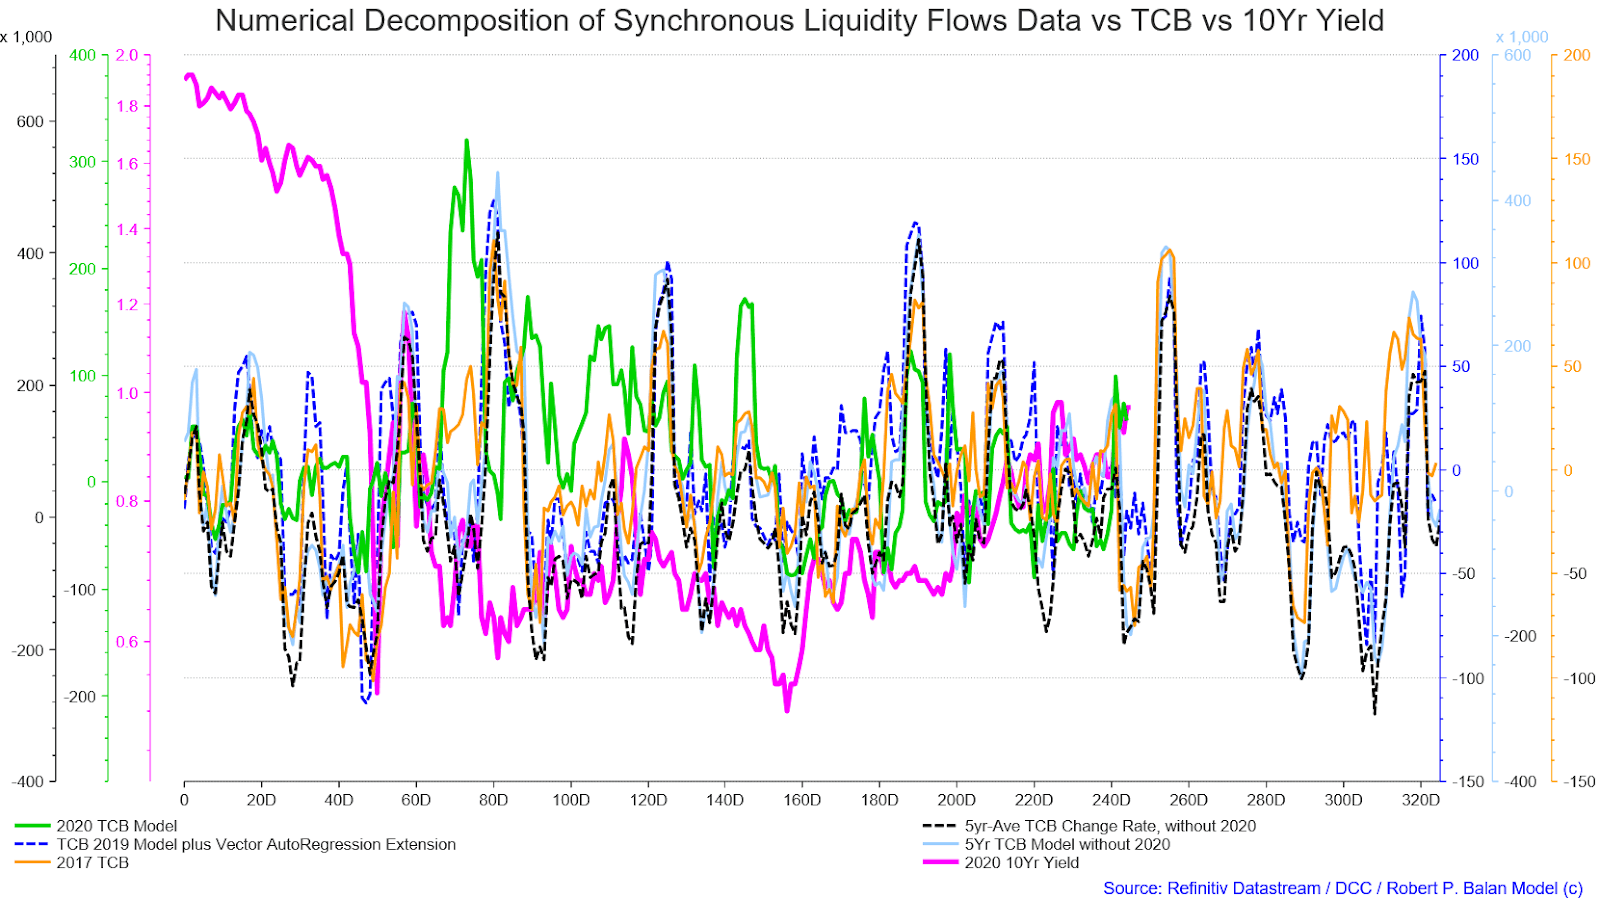
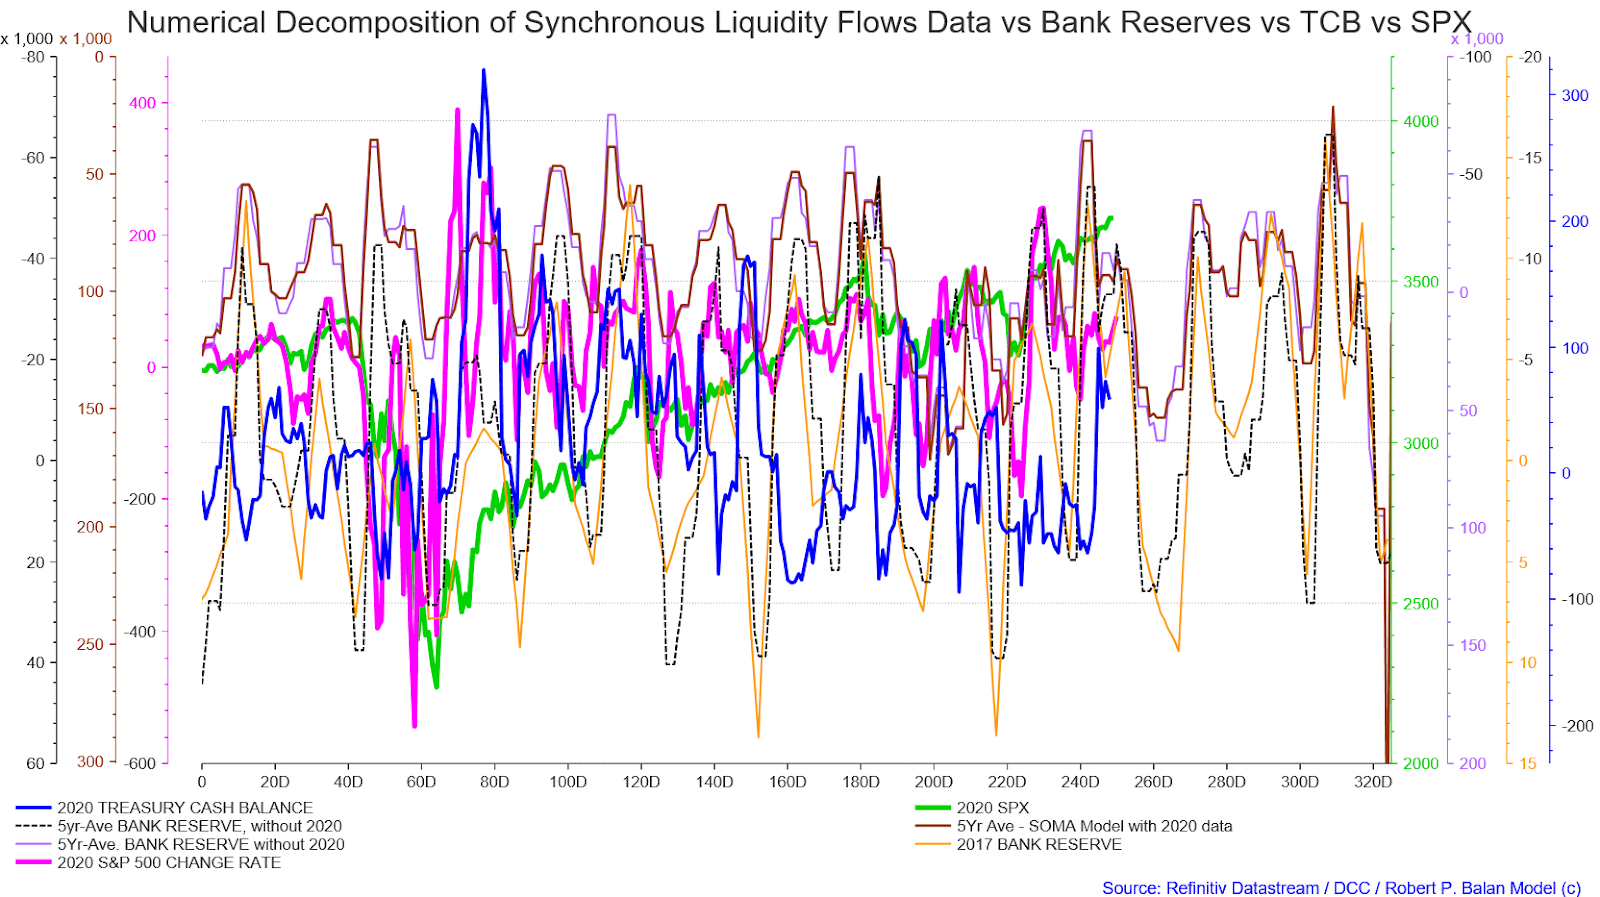
This is how those charts look after Friday's close.
Numerical Decomposition of Synchronous Liquidity Flows Data vs TCB vs 10Yr Yield -- extended to March
Numerical Decomposition of Synchronous Liquidity Flows Data vs Bank Reserves vs TCB vs SPX - extended to March
robert.p.balanModeratorLeaderOwnerDec 6, 2020 8:01 PM
Here is a chart which shows the basic relationship of the Total (Debt) Issuance, the TCB and the Bank Reserves to the 10Yr Yield. This has been shown in one of my earlier articles about systemic liquidity which is buried somewhere in the Getting Started tab.
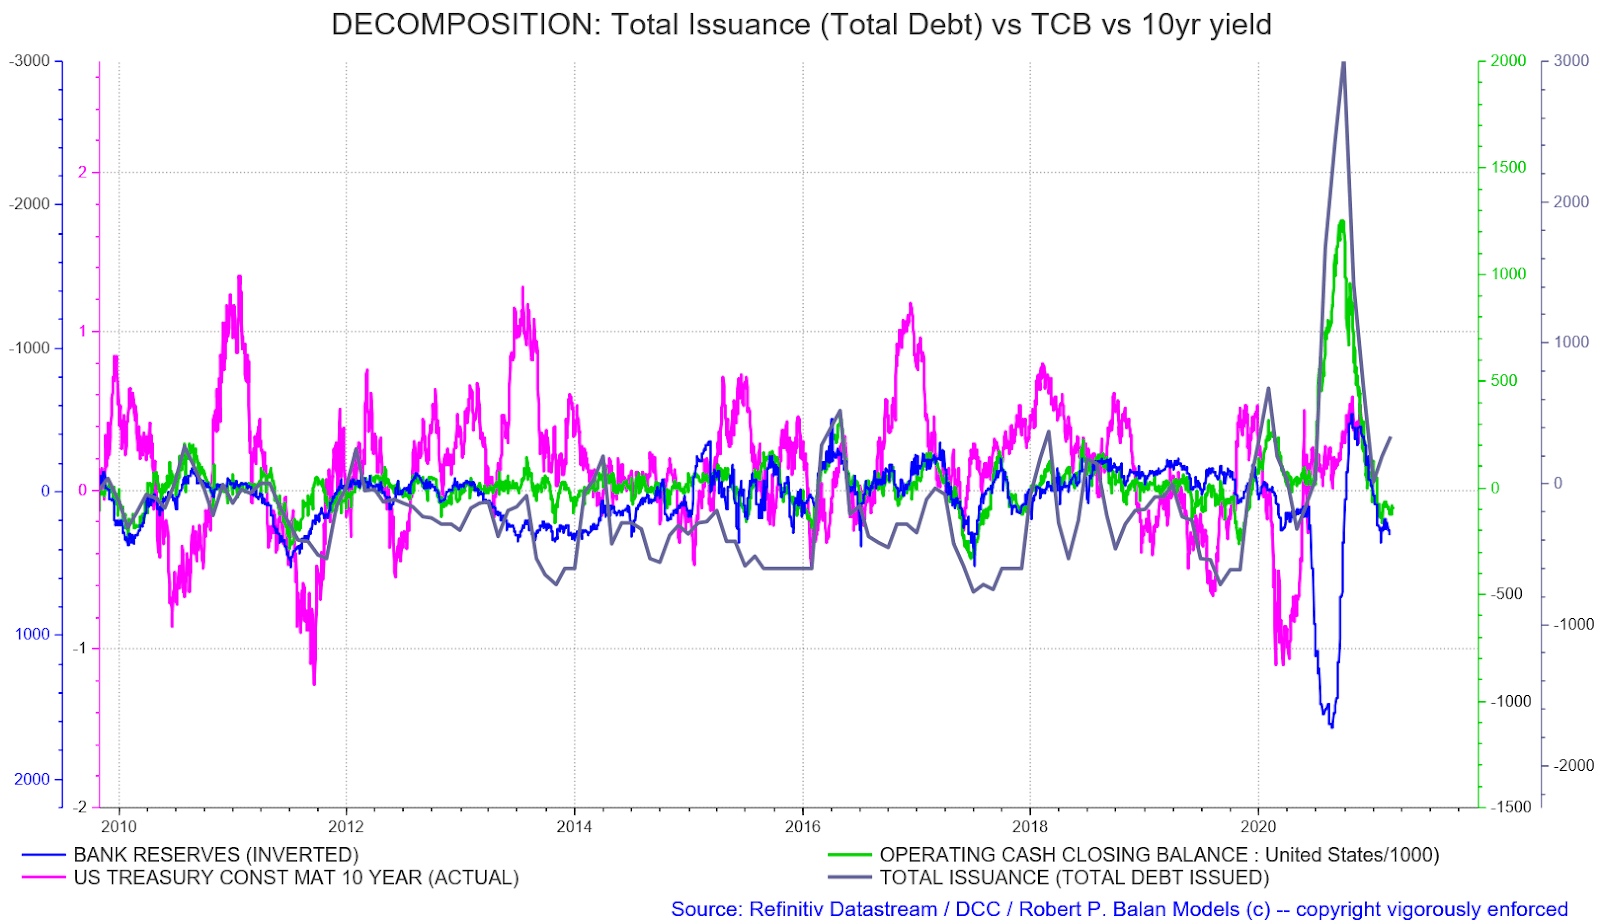
Total Issuance drives the amount of Treasury Cash Balance creation. In most times the rise of TCB diminishes Bank Reserves (it is the yin and yang relationship of an asset (BRS) vs Liability (TCB) -- It is Total Issuance which is driving both TCB and Bank Reserves (in its inverse).The 10yr yield responds directly to Total Issuance but with a lag of several weeks, about three weeks on average (plus or minus 2 weeks).When Issuance rises, TCB rises and BRs falls with a lag of about one week (plus or minus 2 days).
SOMA (Fed balance sheet) also has a tight (but not equivalent) relationship with Bank Reserves -- changes in the SOMA leads changes in Bank Reserves and TCB (shown in its inverse i the chart below).Just the change rates of the liquidity flows -- no models.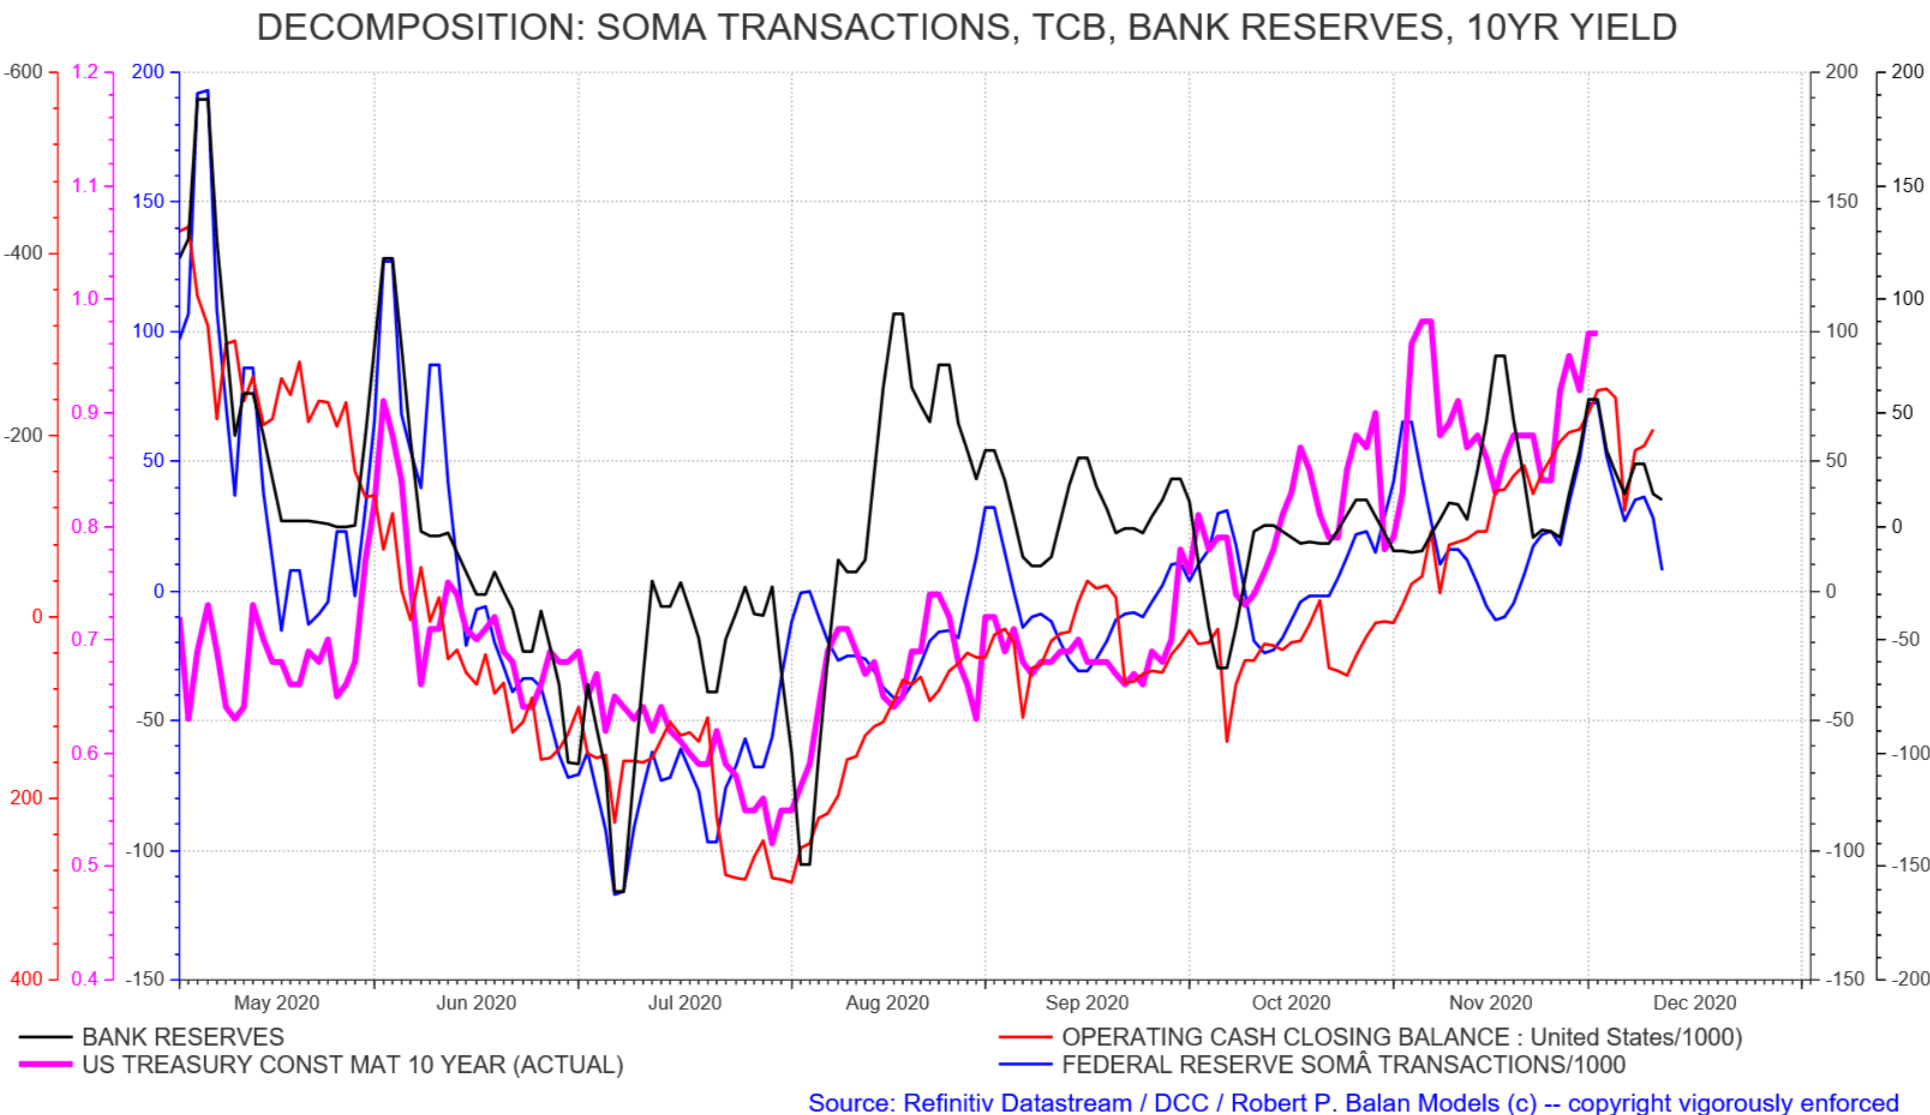
The weekly change rate of the 10Yr yield has one-day predictive forecast horizon when aligned with the change rates of the BR, TCB and SOMA (chart below).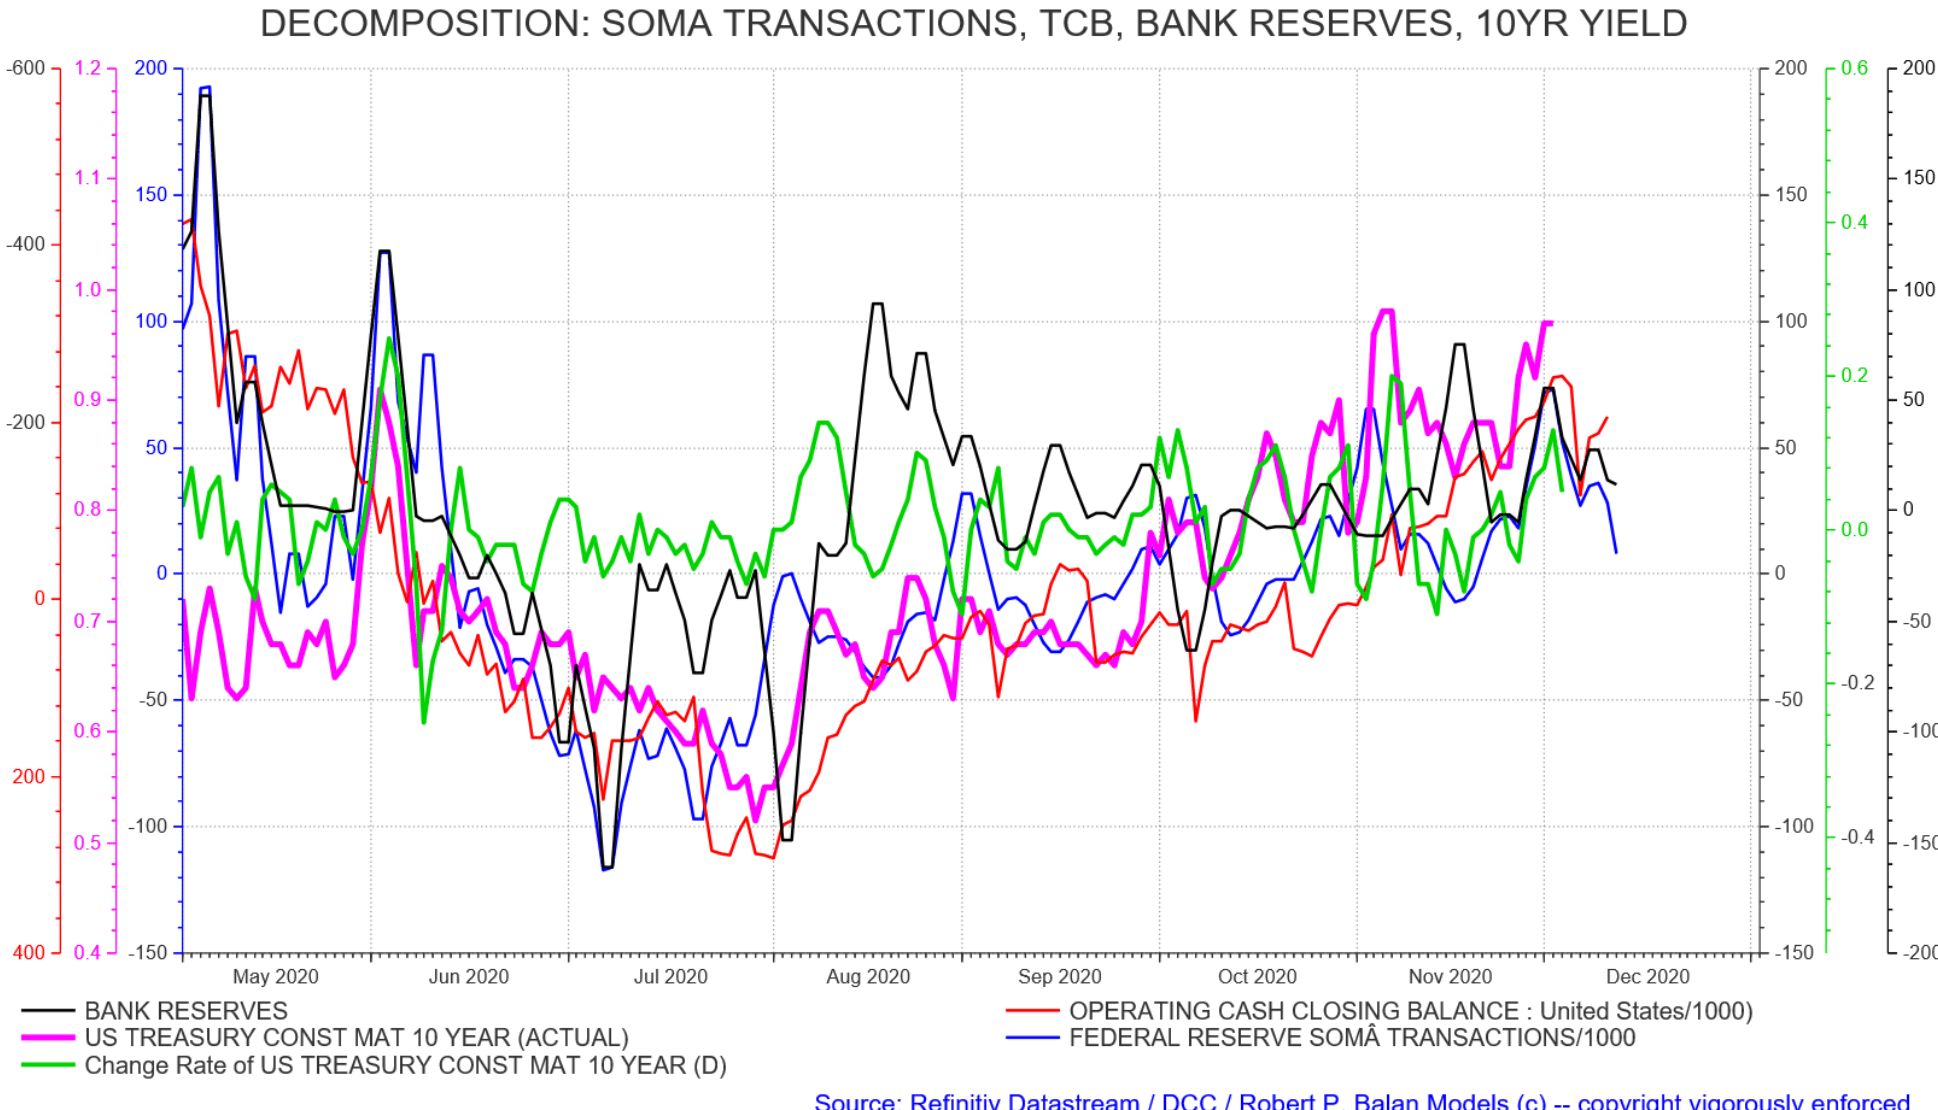
The TCB may bottom between December 18 - 21 and rise sharply into 3rd week of January 2021 -- yields should follow higher correspondingly (chart below).This rise in TCB is consistent with our ongoing work that Treasury Issuance will ratchet up immediately after the Fed meeting on December 16. TCB trails issuance by several days.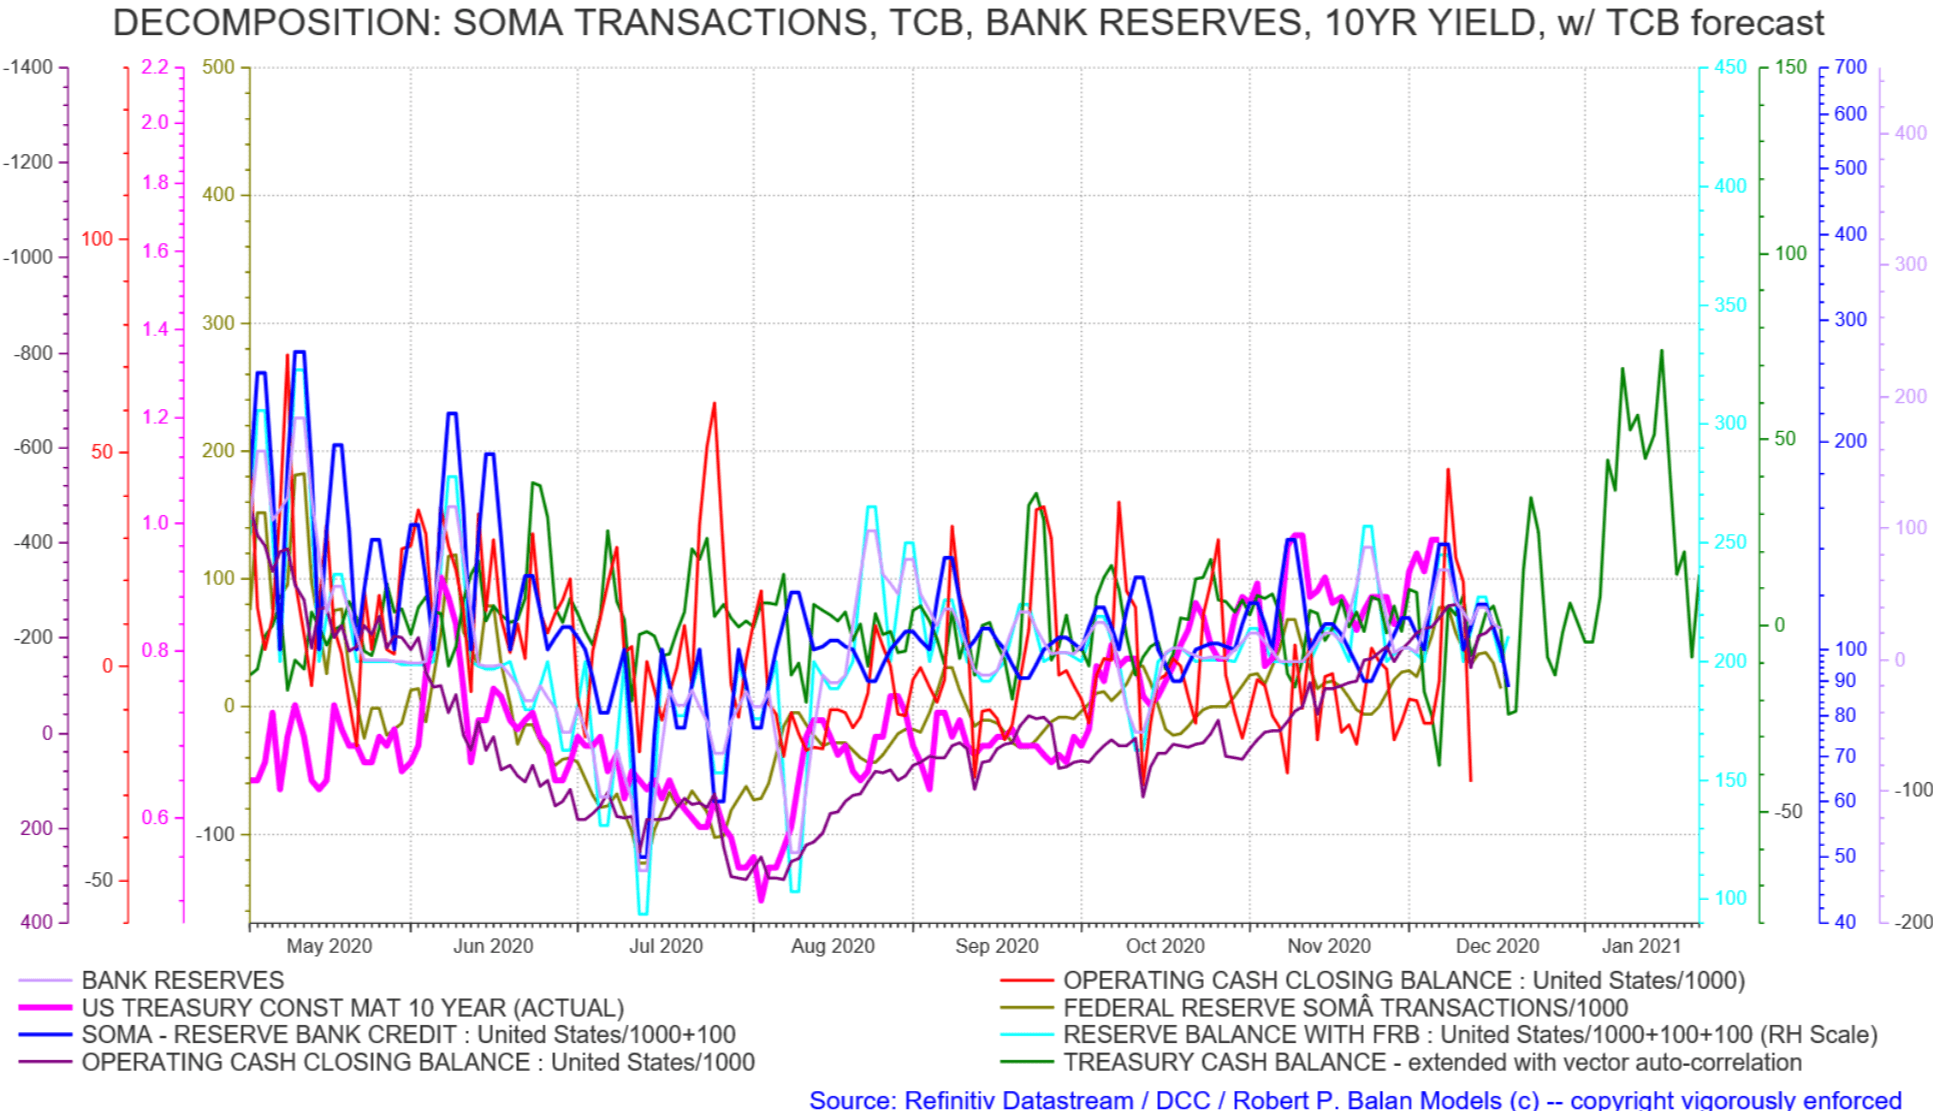
So if the models are correct (chart above), assuming that liquidity still matters during these days of the RobinHooders, the 10yry yield should be falling over the next 10 to 15 trading days (chart below).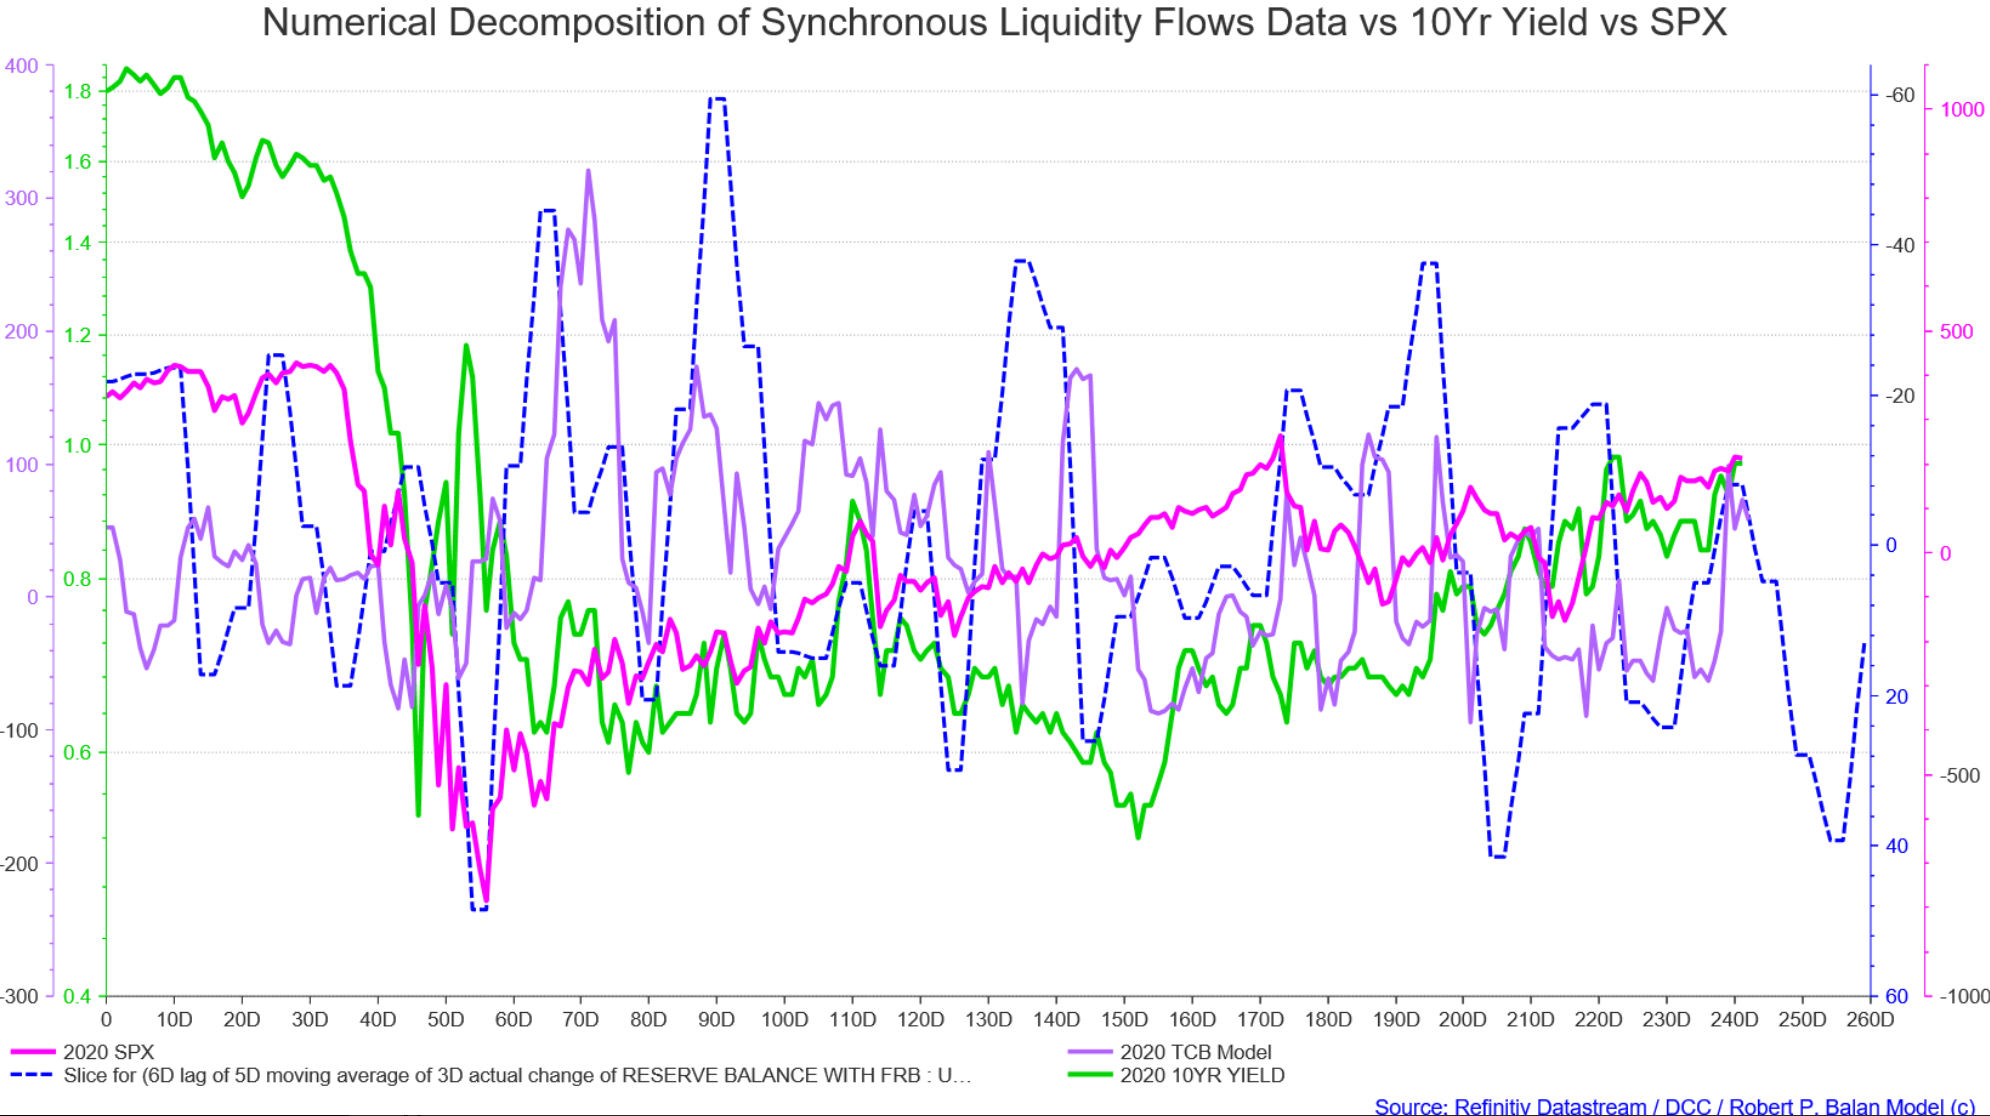
There is no guarantee that equities will decline as well, but I believe that stocks should follow lower after a short lag (may not necessarily occur at this time -- yields are driving the show)
These minor calibrations are needed because we deal with weekly data, which have to be interpolated. Taking the midpoint of the interpolated week can easily provide you and error-range of plus or minus two trading days.
*How to proceed from here:**PAM stays the course, but you don't have to. I am expecting a top Monday, but that can slide into Tuesday. If you don't want to handle that uncertainty, you can hedge long in Asia today, and wait for a top (if it comes). Even assuming your long hedge is stranded if yields and equities do fall out of bed. you should see those long hedges again by first half of January.*
I will of course continue to scalp, upside or downside if given a good opportunity. You don't have to follow suit. If you need your sleep, hedge long and then we will worry about those hedges when/if the top comes. Otherwise, we will see them in first half of January.
jwaxDec 6, 2020 10:15 PM
Thanks, as always, for the direction Robert. Regarding rates declining for the next 10-15 trading days, TN just made a new reaction low (and you keep guiding us away from trying to catch tops and bottoms, and you are right and I keep meaning to follow that advice but it's always so tempting...). What level would you look for TN to breach on the upside (or 10-yr yield on the downside) to confirm the trend change?
robert.p.balanModeratorLeaderOwnerDec 6, 2020 10:27 PM
Mr. Wax --- There has been a lot of discussion abt this at DCC and the consensus is that the MOTUs will try to breach 1%, and stampede the CTAs and HFs into letting go their bond longs. The MOTUs have been salivating over those prospects -- so I believe 10yr above 1% will hammer NQ hard. That will probably buoy RTY/YM temporarily, but if its spooks high tech and high yield -- there is no telling what may happen next.
nffmendoncaDec 6, 2020 10:42 PM
Thanks Robert. Just wanted to pick your brain before this crazy market opens!!! Of course i´ll stay the course, as i´ve told you i have margin until NQ 30K (bit of an exaggeration but you get my drift, i´m still fine). Let´s hope 30K doesn´t come this week the way this markets are going you never know!!
I think hedging now when price is so stretched (i know it can get more stretched, it always can) is an hedge that probably you will have to live with it for a while because some kind of correction (big or small) "has" to happen after all this running, so for hedging i prefer (who doesn´t) lower prices. Let´s hope the opportunity show up. Sleep doesn´t worry me much, i´m like you i sleep 4-5 hours per day and i´m good to go!!! And my 3 little kids wouldn´t let me sleep that much more, so it´s either them or the markets for the reason of my sleep deprivation!
Let´s wait for that top and have a good trading week
robert.p.balanModeratorLeaderOwnerDec 6, 2020 10:44 PM
Thanks for the note Mr. Mendoca -- good luck to you (and to the rest of the community).
Alan.LongbonDec 8, 2020 11:14 PM
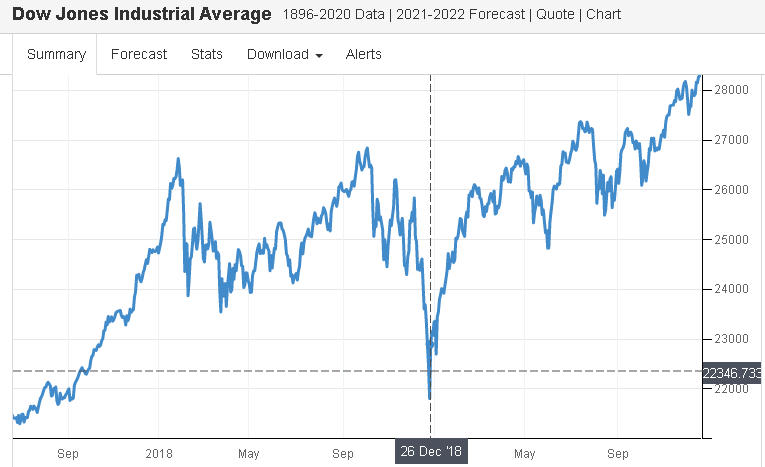
Maybe we get Xmas 2018 again. Just needs the tax drain from the 15th December plus some bad news and down it goes.
presgDec 9, 2020 4:15 AM
Alan.Longbon what tax drain exactly from Dec 15th are you thinking of?
Alan.LongbonDec 9, 2020 8:24 AM
Quarterly corporate and individual income taxes are paid on the 15th and will be at least a $200B drain on bank reserves and a movement of financial assets from the private sector to the public sector. It is why the TCB shoots up seasonally at that time.
Alan.LongbonDec 9, 2020 8:31 AM
It feels like 2018, I have a deja vu feeling where the market defies the prognosis and then suddenly at the last moment it dips just when you have given up on the idea.
stephane.cDec 9, 2020 11:05 AM
At that time there was quantitative tightening, not massive quantitative easing
artbriskDec 9, 2020 11:13 AM
The market 'demanded' monetary easing then. This year it needs to 'demand' more QE. We know the Fed needs an excuse as the Treasury is issuing (and scheduled to issue) a lot more than the Fed is buying, no?
Or do you think the Fed will simply increase the QE levels on 16 Dec?
Alan.LongbonDec 9, 2020 12:02 PM
The Fed will buy whatever it has to to maintain the FFR policy rate. No question and no choice.
robert.p.balanDec 9, 2020 12:48 PM
I believe they will just continue with the existing schedule of monthly securities purchases. Nothing special on December 16 -- why should there be? Stocks are surging, and COVID-19 vaccines are available soon. The US Treasury is soon to embark on a massive buying in January -- what ass-cover will they conjure to justify adding more to their balance sheets?
artbriskDec 9, 2020 1:56 PM
FF rate seem to be well within 0-0.25% range at 0.09% Alan https://apps.newyorkfed.org/markets/autorates/fed funds so the Fed should continue with their existing schedule of $80bn Treasuries and $40bn MBS
The Fed balance sheet is essentially unchanged in the last 3 weeks at $7.3 trl The Fed - Factors Affecting Reserve Balances - H.4.1 - Release Dates
robert.p.balanDec 9, 2020 2:00 PM
That is why the change rate of SOMA is falling and will do so for the next three weeks. If the correlation holds, that^s a three week negative liquidity flow and equities do not get any support from that.
artbriskDec 9, 2020 2:20 PM
Yes, combined with (i) TCB cash not being spent; (II) 200bn tax drain on the 15th mentioned by Alan; (III) decrease in vanna and charm flows next week, if some option 'gurus' are correct; (iv) technical picture - ending diagonal in indices; (V) everybody in on the long side, all with FOMO including some bears -- the omens are looking good for a correction later this or next week.
There must be some trigger though - a negative newsflow or something, to change the extremely positive sentiment. And that's where I have more difficulties.
Perhaps rebalancing by some big funds? Or a no deal Brexit? Or confirmation that no new fiscal stimulus will be announced this year? Or adverse effect reports from initial administering of the vaccine (some articles about allergy today appeared)?
robert.p.balanDec 9, 2020 2:24 PM
No fiscal stimulus likely until January if/when the Dems win Georgia -- if not the Republicans have no desire to bailout blue states. anyway.
artbriskDec 9, 2020 2:34 PM
Yes, this makes sense and PAM analysis of the likely new fiscal stimulus outcome has been correct for months. Yet newsflow manipulation added few % to the indices during these months.
I wonder when the realisation of no new fiscal stimulus to be agreed until next year will arrive and sink in with the majority of the investment community.
Perhaps with everyone long and most shorts covered with heavy losses, it's time for the MOTU's to initiate a play on the short side?
robert.p.balanDec 9, 2020 2:45 PM
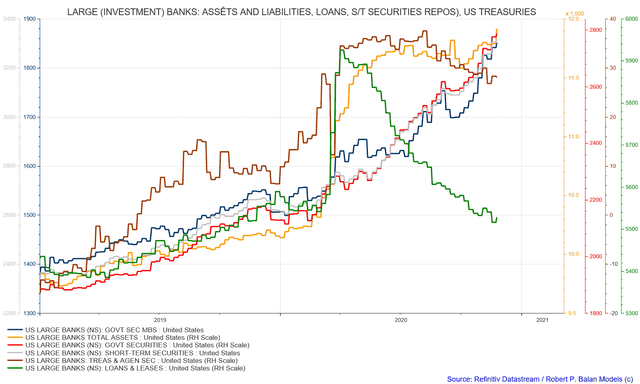
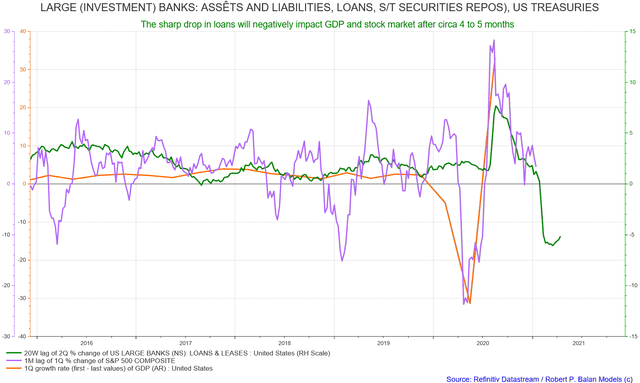
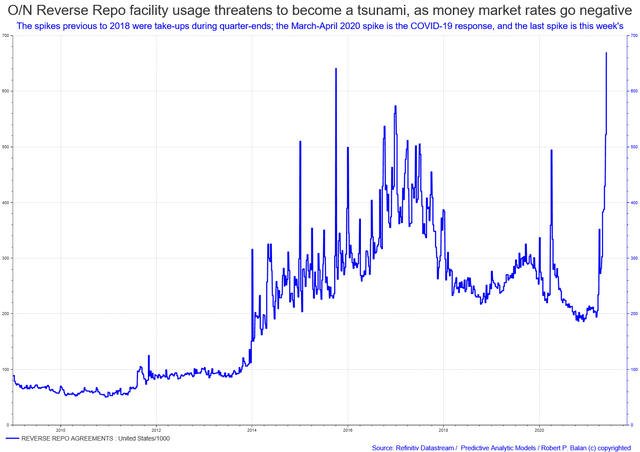
There is a subtle distribution process going on art. The MOTUs sell some, and the BTFD and MOTU maniacs grab that. This is a process until no buyers have the wherewithal to buy what the MOTUs offer. The MOTUs are at their highest leveraged levels about two months ago. $1.75 trillion of net repo borrowings which is like 8 times their total Treasury holdings. Like a $4.5 million mortgage with a pledged collateral of $500,000.
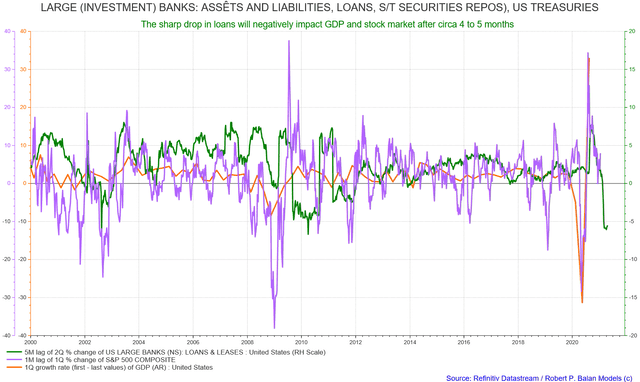
They used that to buy equities in early November. Ostensibly, these borrowing are destined for loans (as the Fed designed it). But instead it went into equities, and loan issuance practically collapsed. Nobody is lending, I will show you the graphs later. There will be hell to pay with regards the economy. That is why GDP will be hitting Zero in Q1/Q2 2021.
artbriskDec 9, 2020 2:51 PM
Thanks Robert! You've explained the distribution process by MOTUs at the top couple of weeks ago - great insight, I've been following it since.
What would make MOTUs stop and shift to the other side? An obvious lack of buy-the-dipers? Or there are other signs/indicators we could monitor?
robert.p.balanDec 9, 2020 2:55 PM
When they sell some, and nobody steps up to the plate anymore -- they will dump. That is your Wave 3.
artbriskDec 9, 2020 2:58 PM
Got it. Thanks Robert
artbriskDec 9, 2020 3:33 PM
$400bn decrease in the combined loan book
robert.p.balanDec 9, 2020 3:48 PM
Loans have a multiplier effect of 8 times
artbriskDec 9, 2020 6:08 PM
On GDP and corporate earnings.
And indirectly on the equity markets with a time lag?
nanobrainDec 9, 2020 8:23 PM
if dems have senate, market will probably start pricing potential tax increase which may lead profit taking in many sectors (tech, bio, housing) in Dec or Jan.
presgDec 9, 2020 9:29 PM
Robert, if possible, can you please show the graph above focusing (magnifying) on the last 5 years?
artbriskDec 9, 2020 10:13 PM
Makes sense intuitively. Thanks Robert. Am I correct in understanding that we now expect a big cyclical bull to begin at some point around mid-March? Or difficult to look so far ahead?
Based on today's price data, can we now assume we are in wave 1 down and draw EW schemata - wave 2 to wave 5 for December leg down?
Great trading today!

Comments
Log in or sign up to join the conversation.