

Here we go again – Fed Day, March 2017. While this is but the first of several central bank meetings this week – the Bank of Japan, the Bank of England, and the Swiss National Bank are also slated to meet – the gathering of Janet Yellen’s bunch is likely the most important.
The futures market is pricing in a nearly 100% chance that Yellen & Co. are going to raise the Fed Funds target rate by 0.25% today. As such, there is likely to be very little drama surrounding the announcement.
However, this does not mean that there won’t be drama, or perhaps more accurately, volatility, when Janet Yellen starts taking questions from the press later this afternoon. You see, today isn’t so much about what the Fed is doing now, but rather what they are going to do in the future.
At this stage, the consensus thinking is that the Ms. Yellen will raise rates three times during calendar year 2017. Thus, if there is any commentary suggesting otherwise, the trading computers will likely start to hum.
One key that most everyone will be watching today is the “Dot Plot” – a chart showing where each FOMC member expects interest rates to be going forward. In case you aren’t familiar, below is the now famous “dot plot” chart.
(Click on image to enlarge)
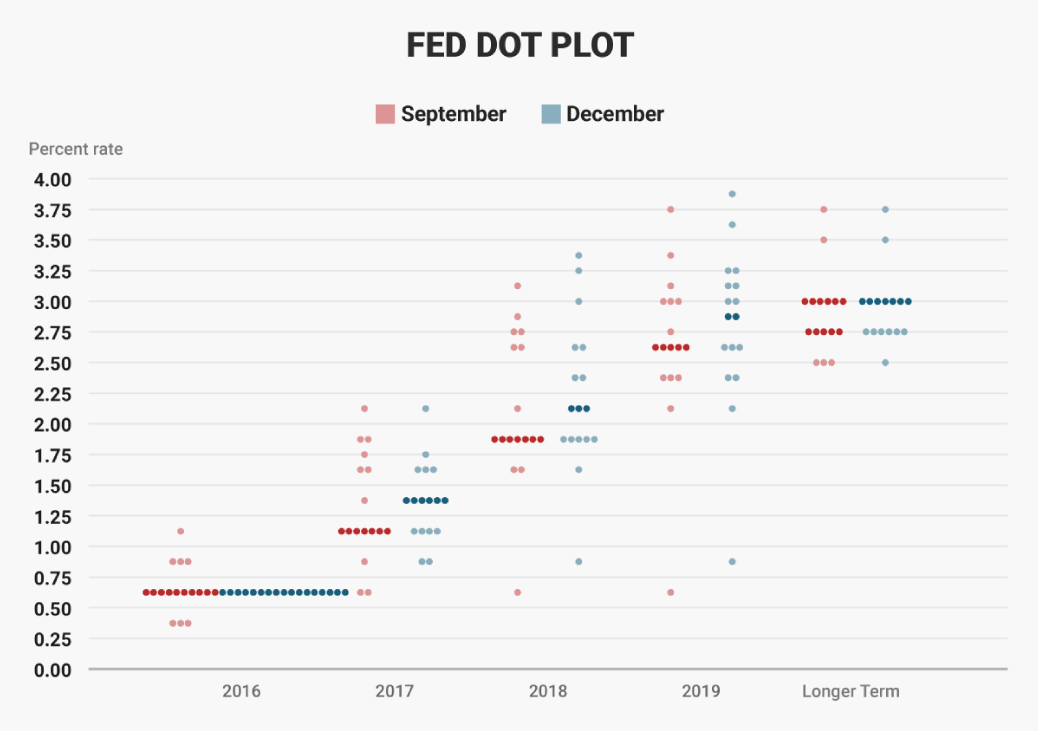
If one “follows the dots” over time (the chart above compares the “dots” from the September and December meetings), the Fed’s thinking can become clear. As such, where the “dots” fall today will be heavily scrutinized.
Markets Waiting At Key Technical Levels
As for the markets, traders tend to position themselves at key technical levels in front of major events – and today appears to be no different.
For the bond market, the yield on the U.S. 10-Year Treasury Note is currently resting just below the all-important 2.6% level. Why is this rate important, you ask? In short, because (a) this was the high-water market during the “reset” after the election and (b) former “Bond King” Bill Gross says that a move above 2.6% would signal the start of a secular bear market in bonds.
10-Year Treasury Note Yield – Daily
(Click on image to enlarge)
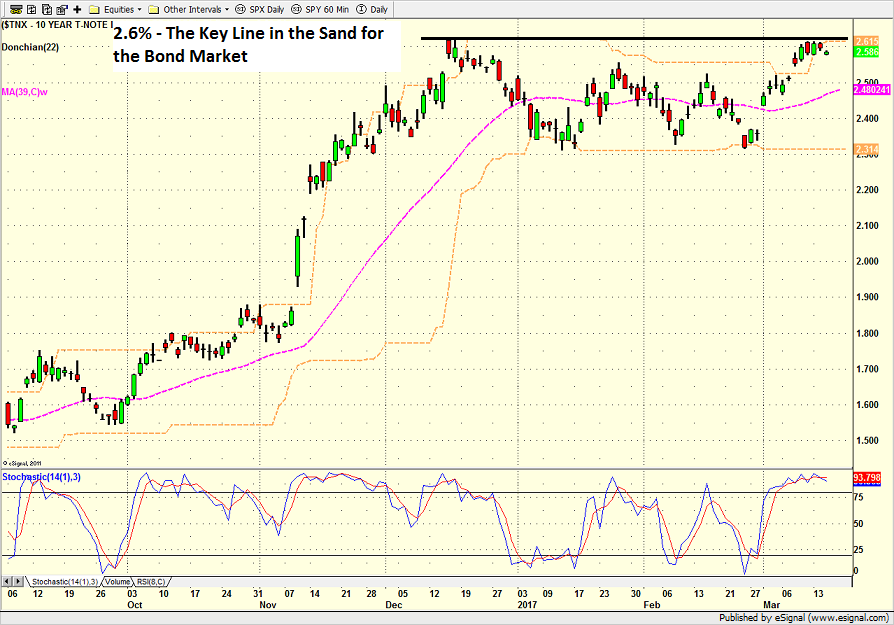
While we don’t completely agree with the premise that the 2.6% level is the line of demarcation for such a massive sea change in the bond market, we will agree that traders are watching this level VERY closely. And if breached to the upside on account of the Fed “surprising” the markets with a more hawkish view, then rest assured that prices of bonds could move swiftly to the downside.
As for the stock market, traders appear to also have positioned the S&P at a critical juncture – from a short-term perspective.
S&P 500 – Daily
(Click on image to enlarge
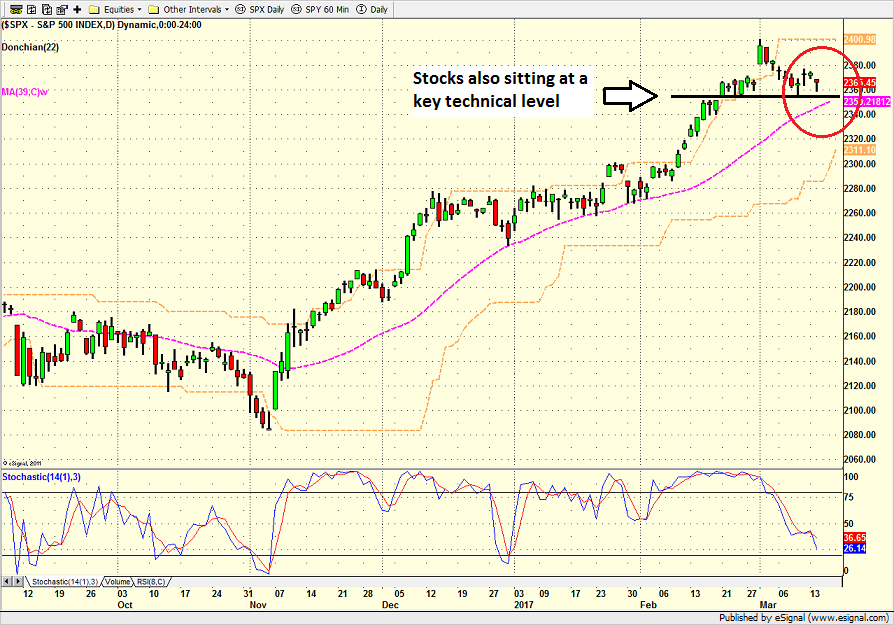
To this point, the pullback that everybody on the planet has been expecting has been a rather meek and mild affair, with the S&P closing yesterday just 1.27% below the post-State of the Union address high. However, should Ms. Yellen or “the dots” surprise traders in a negative way, this line in the sand could easily be washed away by a wave of selling.
In sum, the stock and bond markets appear to be sitting at important spots on their respective charts, poised and ready to react quickly to any surprises today.
Thought For The Day:
My definition of a free society is a society where it is safe to be unpopular. – Adlai E. Stevenson Jr.
Current Market Drivers
We strive to identify the driving forces behind the market action on a daily basis. The thinking is that if we can both identify and understand why stocks are doing what they are doing on a short-term basis; we are not likely to be surprised/blind-sided by a big move. Listed below are what we believe to be the driving forces of the current market (Listed in order of importance).
1. The State of the Fed’s Next Move (After Wednesday)
2. The State of Trump Administration Policies
3. The State of the U.S. Economy
4. The State of Global Central Bank Policies (Think ECB pulling back on QE)



Comments
Log in or sign up to join the conversation.