

One of the (many) uses of Layered Charts is what I call the “Fed Spread” which ostensibly predicts where the S&P 500 should be in a couple of weeks’ time. Here, hot off the press, are the component parts:
(Click on image to enlarge)

Balance Sheet
(Click on image to enlarge)
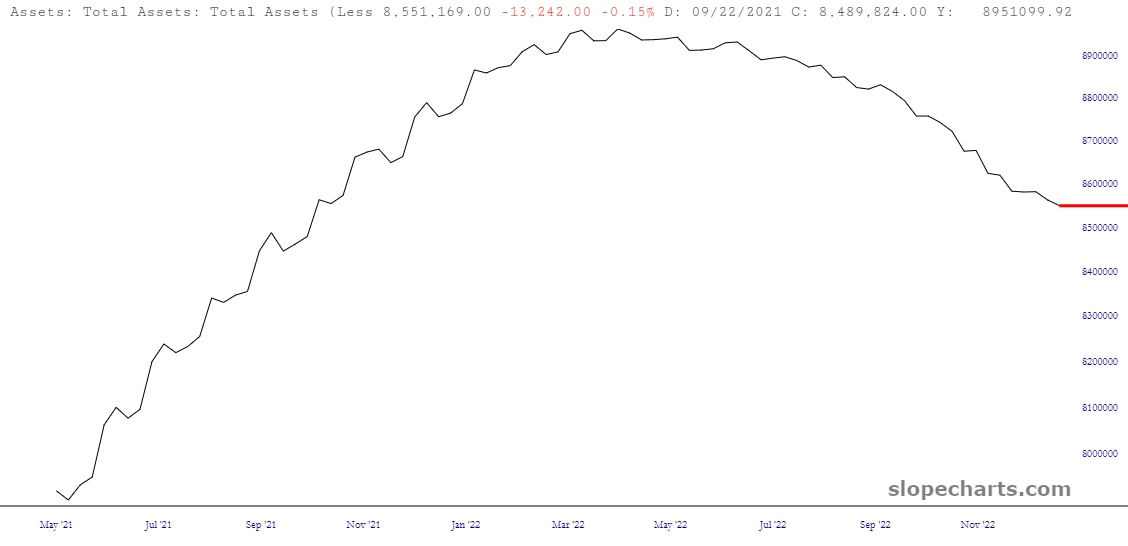
Assets Held by Fed
(Click on image to enlarge)
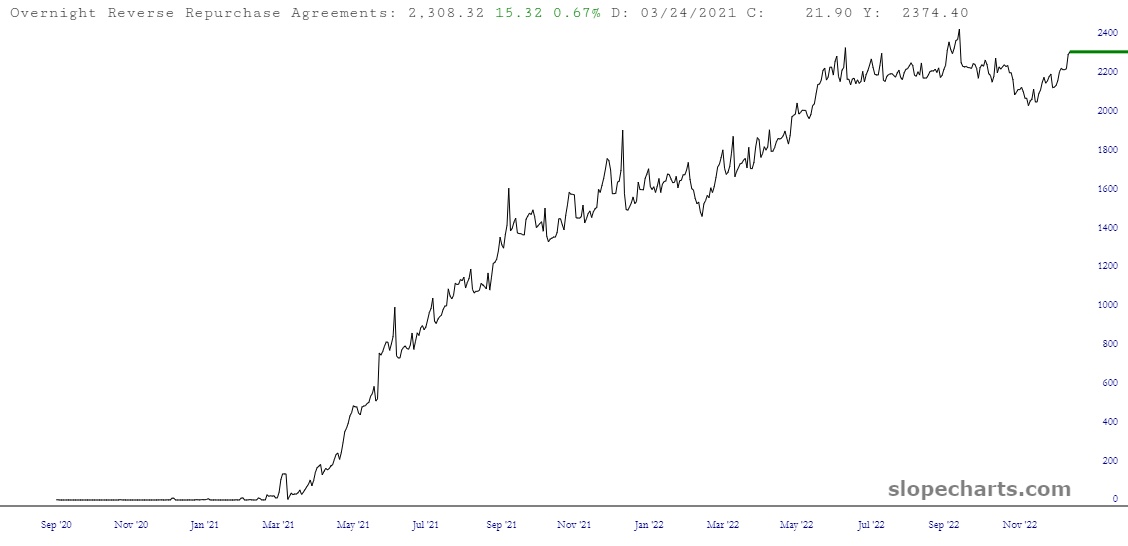
Overnight Reverse Repo
Mash ’em together, roll ’em out, bake ’em, and you get…
(Click on image to enlarge)
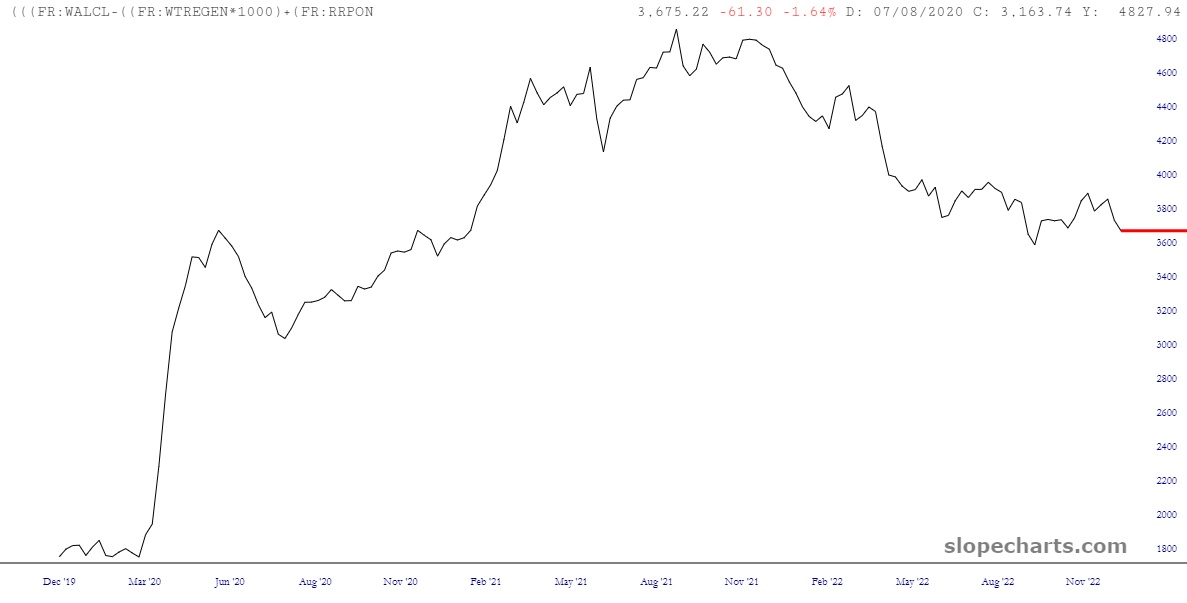
Behold: the Fed Spread
In other words, we’re about 200 points overvalued right.
More By This Author:
Tesla Volume Soaring During Plunge
One Of 2022’s Biggest Shifts
Can Santa Crash This Party?


Comments
Log in or sign up to join the conversation.