
We can use our data to track individual stocks, industries, sectors, and indices. For today's bulletin, we present key metrics for the top picks in the Nasdaq 100. The companies listed below represent the top-ten BUY and STRONG BUY stocks within the index. They are presented below according to their one-month forecast target prices.
We have three new companies on our list since the last time we presented the top NASDAQ picks at the beginning of March. Amgen, Activision, and Netease are new--they replaced AAL, CA, and BIDU. Gilead, Broadcom, Citrix, and Microsoft have declined. Cisco Systems moved into the top-five. Our new leader is LAM Research.
(Click on image to enlarge)
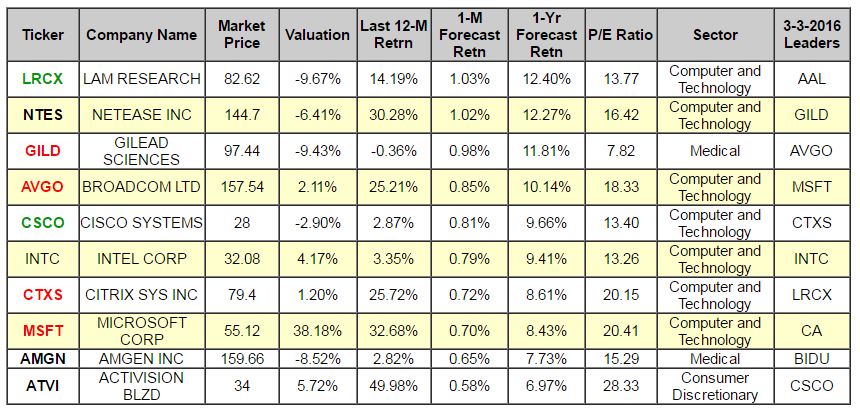
Note: New stocks are in BOLD, old stocks that have moved up the list are in GREEN, old stocks that have declined in position are in RED, and stocks which have retained their position are in CAPS.
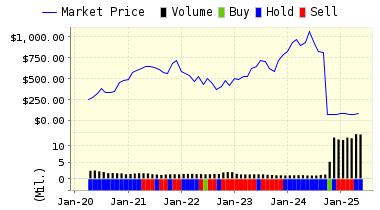
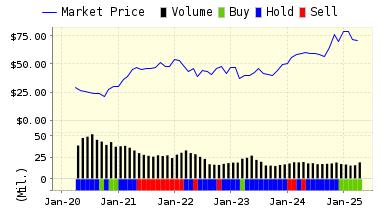
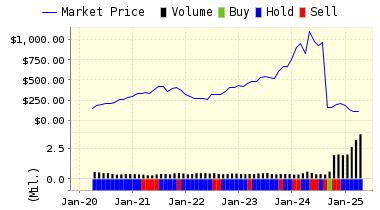
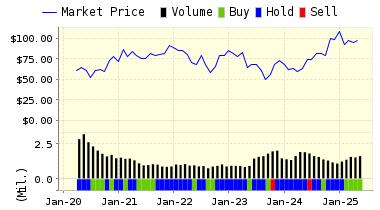
Below is today's data on LAM Research (LRCX):
Lam Research Corporation designs, manufactures, markets and services semiconductor processing equipment used in the fabrication of integrated circuits. Lam is recognized as a leading supplier of front-end wafer processing equipment to the worldwide semiconductor industry. The Company's products are used selectively to etch away portions of various films to create an integrated circuit.
Recommendation: We continue the STRONG BUY recommendation on LAM RESEARCH for 2016-04-06. Based on the information we have gathered and our resulting research, we feel that LAM RESEARCH has the probability to OUTPERFORM average market performance for the next year. The company exhibits ATTRACTIVE Company Size and Momentum.
|
ValuEngine Forecast |
||
|
Target |
Expected |
|
|---|---|---|
|
1-Month |
83.47 | 1.03% |
|
3-Month |
83.81 | 1.44% |
|
6-Month |
84.53 | 2.31% |
|
1-Year |
92.87 | 12.40% |
|
2-Year |
85.98 | 4.07% |
|
3-Year |
76.60 | -7.28% |
|
Valuation & Rankings |
|||
|
Valuation |
9.67% undervalued |
Valuation Rank( |
|
|
1-M Forecast Return |
1.03% |
1-M Forecast Return Rank |
|
|
12-M Return |
14.19% |
Momentum Rank |
|
|
Sharpe Ratio |
0.28 |
Sharpe Ratio Rank |
|
|
5-Y Avg Annual Return |
7.54% |
5-Y Avg Annual Rtn Rank |
|
|
Volatility |
26.68% |
Volatility Rank |
|
|
Expected EPS Growth |
15.00% |
EPS Growth Rank |
|
|
Market Cap (billions) |
13.16 |
Size Rank |
|
|
Trailing P/E Ratio |
13.77 |
Trailing P/E Rank |
|
|
Forward P/E Ratio |
11.97 |
Forward P/E Ratio Rank |
|
|
PEG Ratio |
0.92 |
PEG Ratio Rank |
|
|
Price/Sales |
2.23 |
Price/Sales Rank |
|
|
Market/Book |
3.57 |
Market/Book Rank |
|
|
Beta |
1.29 |
Beta Rank |
|
|
Alpha |
0.17 |
Alpha Rank |
Market Overview
|
Summary of VE Stock Universe |
|
|
Stocks Undervalued |
61.85% |
|
Stocks Overvalued |
38.15% |
|
Stocks Undervalued by 20% |
26.93% |
|
Stocks Overvalued by 20% |
11.85% |
Sector Overview
|
Sector |
Change |
MTD |
YTD |
Valuation |
Last 12-MReturn |
P/E Ratio |
|
Utilities |
0.42% |
-0.35% |
3.93% |
8.91% overvalued |
-3.68% |
24.04 |
|
Consumer Staples |
0.27% |
-1.85% |
4.86% |
5.67% overvalued |
-3.70% |
22.49 |
|
Multi-Sector Conglomerates |
0.36% |
-1.08% |
15.83% |
4.79% overvalued |
-6.19% |
25.80 |
|
Basic Materials |
0.68% |
-0.54% |
2.03% |
1.18% overvalued |
-9.26% |
22.12 |
|
Industrial Products |
-0.04% |
-2.39% |
2.09% |
0.83% overvalued |
-11.73% |
16.83 |
|
Computer and Technology |
0.68% |
-0.90% |
3.05% |
0.60% undervalued |
-14.34% |
18.91 |
|
Aerospace |
0.53% |
-0.80% |
3.66% |
3.91% undervalued |
-8.84% |
26.95 |
|
Consumer Discretionary |
1.09% |
0.01% |
14.78% |
4.18% undervalued |
-5.05% |
21.63 |
|
Finance |
0.48% |
0.32% |
-2.62% |
4.51% undervalued |
-11.41% |
19.86 |
|
Business Services |
0.38% |
-0.82% |
-2.35% |
5.40% undervalued |
-8.29% |
15.68 |
|
Retail-Wholesale |
0.33% |
-1.04% |
1.11% |
5.44% undervalued |
-10.65% |
24.24 |
|
Construction |
0.68% |
-1.33% |
-0.66% |
7.30% undervalued |
-14.05% |
22.34 |
|
Auto-Tires-Trucks |
2.07% |
-2.04% |
-1.17% |
7.98% undervalued |
-39.39% |
22.13 |
|
Oils-Energy |
2.05% |
2.63% |
-5.09% |
10.91% undervalued |
-19.37% |
26.20 |
|
Medical |
0.39% |
-3.28% |
-1.80% |
11.57% undervalued |
-18.50% |
11.88 |
|
Transportation |
0.36% |
-1.56% |
-0.17% |
14.43% undervalued |
-28.94% |
13.09 |
Valuation Watch: Overvalued stocks now make up 38.15% of our stocks assigned a valuation and 11.85% of those equities are calculated to be overvalued by 20% or more. Five sectors are calculated to be overvalued.
Comments
Log in or sign up to join the conversation.