
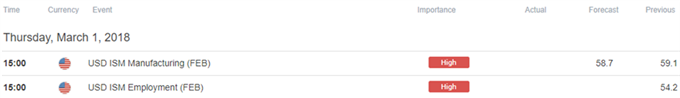
Trading the News: U.S. ISM Manufacturing
A minor downward revision in the U.S. ISM Manufacturing survey may do little to curb the recent decline in EUR/USD as the Federal Open Market Committee (FOMC) appears to be on course to deliver a March rate-hike.
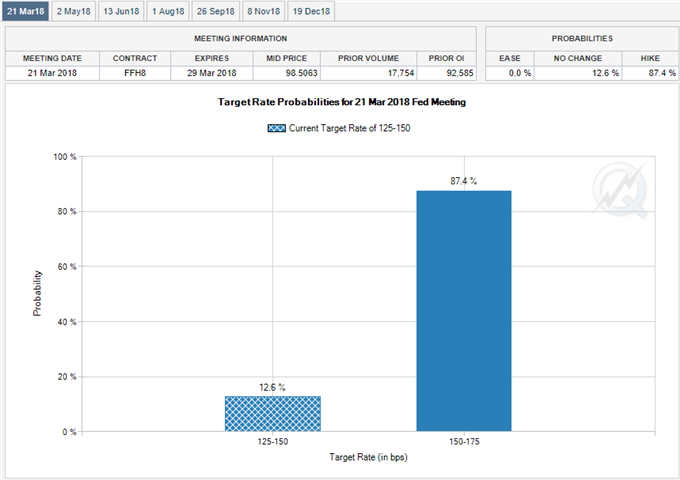
The U.S. dollar remains bid following the testimony from Chairman Jerome Powell, and the greenback may stage a larger recovery over the coming days as Fed Fund Futures now highlight a greater than 80% probability for a March rate-hike.
Governor Powell and Co. may continue to cast a hawkish outlook for monetary policy as ‘headwinds the U.S. economy faced in previous years have turned into tailwinds,’ and the bar appears high for the FOMC to slow down its hiking-cycle as officials ‘anticipate that inflation on a 12-month basis will move up this year and stabilize around the FOMC's 2 percent objective over the medium term.’
At the same time, a clear deviation from market expectations may fuel the recent depreciation in EUR/USD as it fosters speculation for four Fed rate-hikes in 2018.
Impact that the U.S. ISM Manufacturing survey has had on EUR/USD during the previous release
|
Period |
Data Released |
Estimate |
Actual |
Pips Change (1 Hour post-event ) |
Pips Change (End of Day post-event) |
|
JAN 2018 |
02/01/2018 15:00:00 GMT |
58.6 |
59.1 |
+23 |
+66 |
January 2018 ISM Manufacturing
EUR/USD 5-Minute Chart
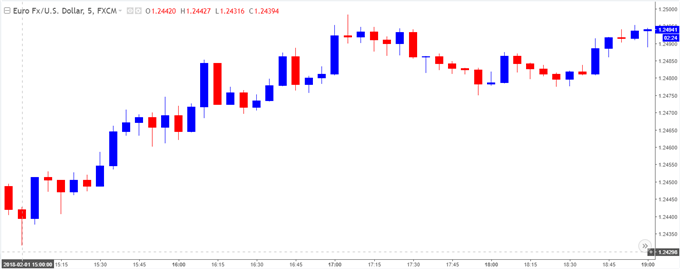
The ISM Manufacturing survey was little changed in January, with the index narrowing to 59.1 from a revised 59.3 in December 2017. A deeper look at the report showed the Employment component slipping to 54.2 from a 58.1, with the gauge for New Orders falling to 65.4 from 67.4, while the index for Prices Paid climbed to 72.7 from 68.3 during the same period to mark the highest reading since May 2011.
The minor revisions to the business confidence survey generated a limited reaction, with EUR/USD largely gaining ground throughout the day to close at 1.2508.
EUR/USD Daily Chart
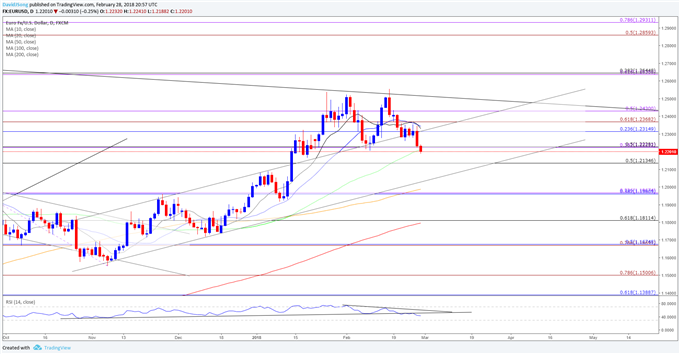
- Downside targets are on the radar for EUR/USD as the pair now snaps the February range, with the near-term outlook capped by the 1.2320 (23.6% retracement) to 1.2370 (61.8% expansion) region.
- Next area of interest coming in around 1.2130 (50% retracement) followed by the 1.1960 (38.2% retracement) to 1.1970 (23.6% expansion) region, which sits just below the 100-Day SMA (1.1987).
- Keeping a close eye on the Relative Strength Index (RSI) as it extends the bearish formation from earlier this month and appears to be making its way towards oversold territory.


Comments
Log in or sign up to join the conversation.