


KOSPI Bubble Burst — Cheap yet?
Depending on how you look at it your answer might be either:
Definitely yes, record cheap valuations!! [Forward PE]
Yes, decent reset, looks cheap now. [Trailing PE ratio]
Hmm, not yet, still looks expensive. [PE10/Shiller PE]
As with all things it depends how you look at it (chart below compares).
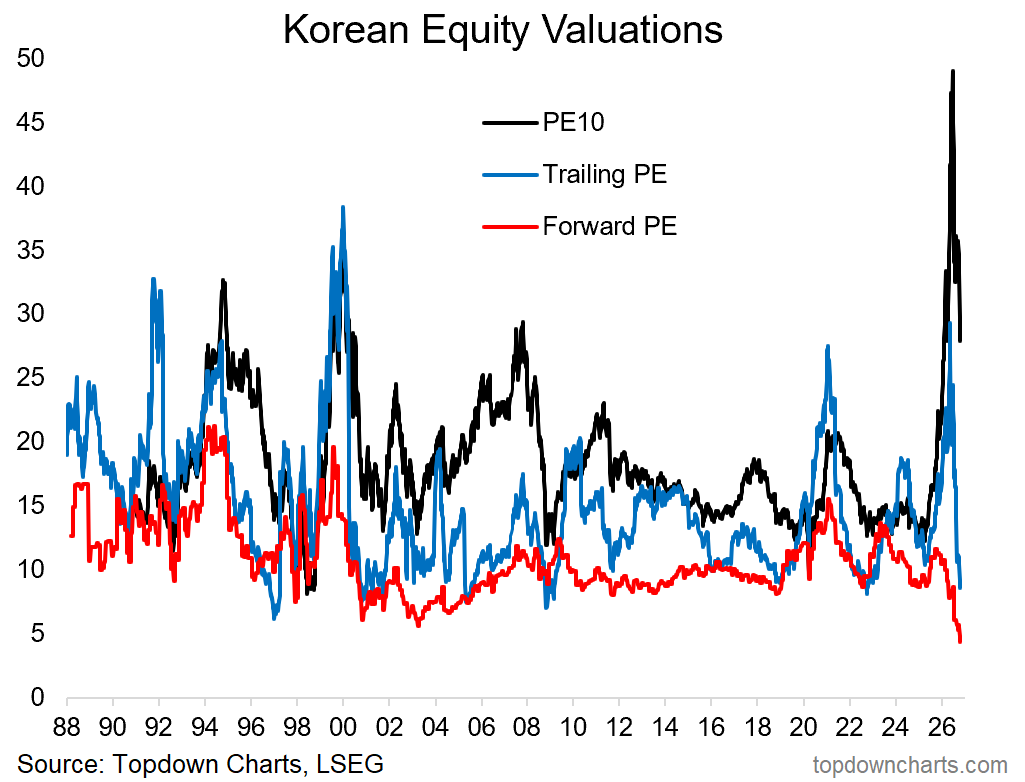
Each of those different PE ratios have different strengths/weaknesses.
The forward PE can be more accurate in times of large and rapid changes (e.g. if earnings are ramping up/down by a large permanent amount), but at the same time it is based on an estimate of the future (and you know what they say about forecasts…)
The trailing PE uses objective information (actual earnings), but can be wildly swung around if earnings plunge due to short-term or one-off effects, it also inherently assumes that the trailing 12-months of earnings are representative of normal earnings (sometimes that is a true assumption, but in times of rapid change [up or down] it can be misleading).
The PE10 uses the average of the last 10 years of actual earnings to smooth out the cyclical gyrations and short-term ups and downs in earnings, to give a consistent basis of comparison. But there are times when earnings make a structural step-change down (e.g. if a country goes through a major credit boom and bust cycle, or if an industry is in sunset), or structural step-change up (e.g. AI capex boom, economic reforms, etc). So it also has its strengths and weaknesses as a metric.
The chart below attempts to reconcile the varying strengths/weaknesses of each of the three main different PE ratios —by simply taking the average of all 3.
On this lens it looks cheap. Not rock-bottom, but getting there.
As a minimum we have seen a massive adjustment from previously extreme expensive levels that were highly at risk; this indicator correctly sounded the warning at the top (but as I noted in my latest note, there is more to it than that).
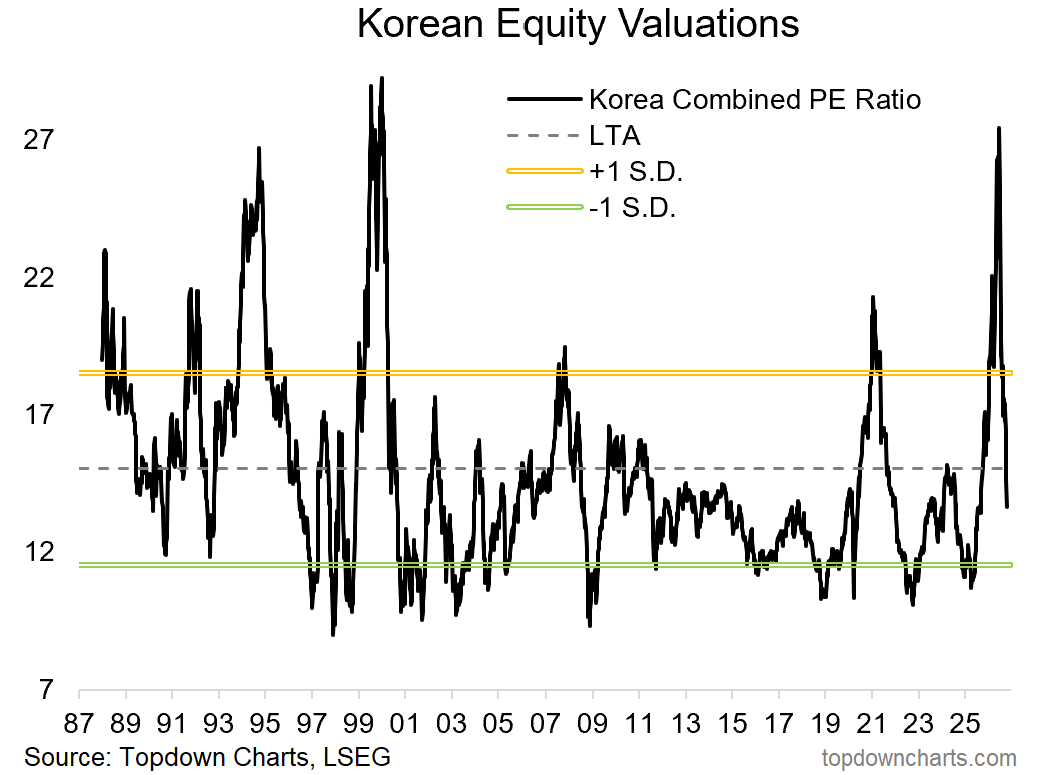
So yes, they do look cheap, and certainly much cheaper than where they got to at the peak. But there are still a few uncertainties, and in the end that will always be a true statement when you see a valuation indicator make a big adjustment…
There are always reasons to buy when something is extreme expensive.
There are always reasons NOT to buy when something is extreme cheap.
That’s why my process puts significant weight on valuations —but only as one of the 5 key factors for generating profitable investment ideas.
Bonus Chart: the moving target…
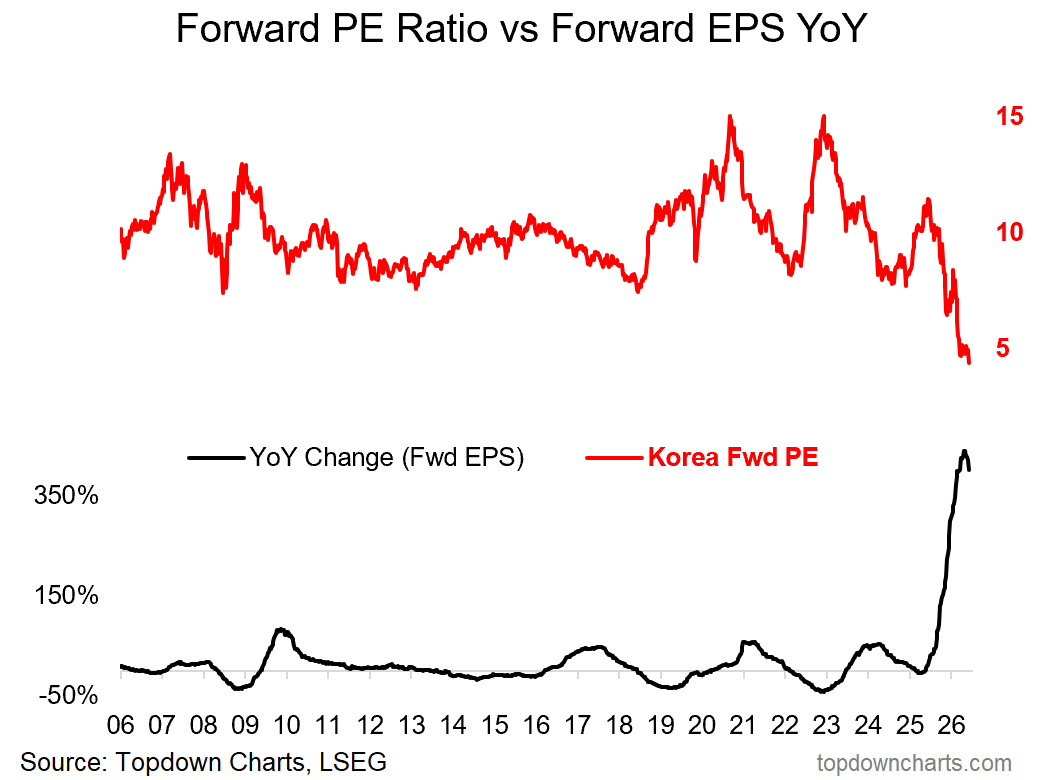
One of the key reasons the KOSPI previously surged over +200% to the peak in June was surging earnings estimates —largely relating to the AI capex boom.
(n.b. for reference the KOSPI is basically about 50% chip stocks)
The chart below puts this in perspective: forward EPS had been revised up 4x on a year-over-year basis, this is astronomical. But as noted it is a moving target, and chips are historically a notoriously boom-bust sector. And in fact the rate of growth has now peaked.
So again, you have to weigh-up cheap forward PE ratios against the potential for one (or a combination) of the 3 big downside risks to earnings: a cyclical downturn (e.g. a global economic recession would derail earnings), competitive disruption in semis/chips (e.g. the CXMT breakthrough), and eventual AI capex boom-bust cycles playing through (because busts follow booms like night follows day).


Comments
Log in or sign up to join the conversation.