

Kiwi is down nearly 2% from the monthly highs against the US Dollar with last night’s Reserve Bank of New Zealand (RBNZ) interest rate decision fueling a break below monthly open support. These are the updated targets and invalidation levels that matter on the NZD/USD charts.
NZD/USD DAILY PRICE CHART
(Click on image to enlarge)
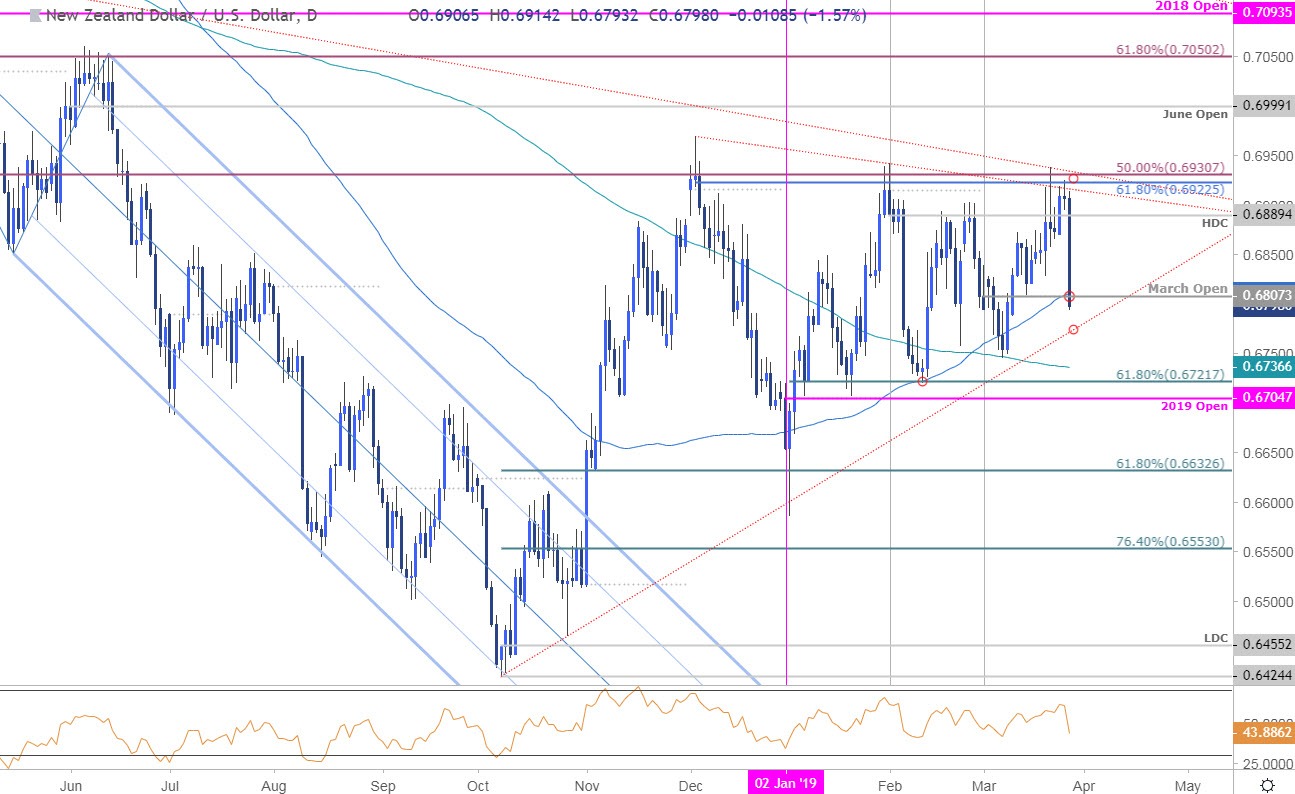
Technical Outlook: In my latest NZD/USD Weekly Technical Outlook, our bottom line noted that price was, “responding to confluence resistance / the yearly opening-range highs and leaves the immediate advance vulnerable sub-6941. From trading standpoint, a good place to reduce long-exposure / raise protective stops and be on the lookout for possible price exhaustion.” Price reversed off confluence resistance early in the week at 6923/31 with a dovish RBNZ last night fueling a decline of nearly 1.6% today.
A close below the 100-day moving average / March open at 6807/10 would leave the risk lower targeting trendline support extending off the 2018 lows, currently around ~6770s. A break below this threshold exposes the 200-day moving average at ~6737 backed by the 61.8% retracement of the 2019 range at 6722.
NZD/USD 120MIN PRICE CHART
(Click on image to enlarge)
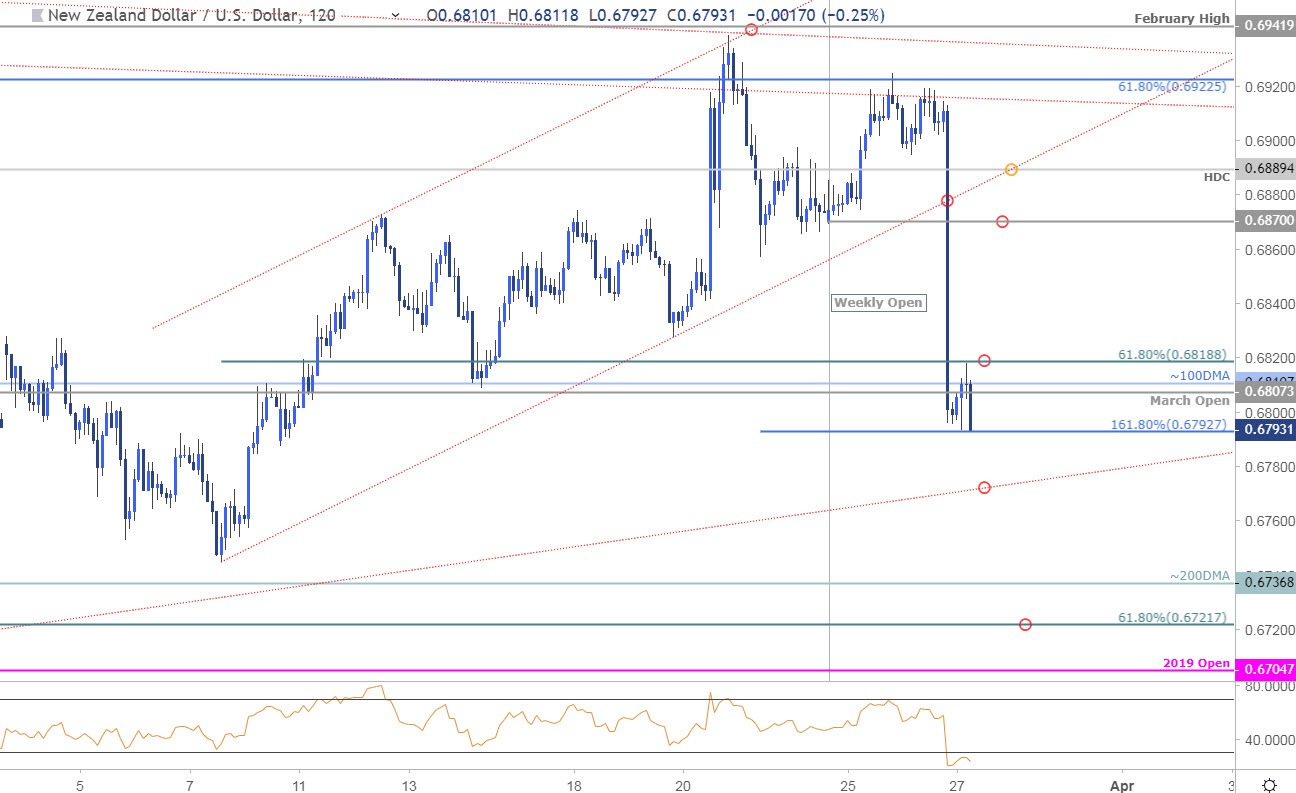
Notes: A closer look at price action shows Kiwi breaking below weekly open / channel support today with the decline now testing the 1.618% extension of the decline at 6793. Initial resistance now 6819 backed by 6870 with bearish invalidation now lowered to the yearly high-day close at 6889.
Bottom line: Kiwi has turned from multi-month consolidation resistance and keeps the focus on a reaction just lower near the 2018 trendline. From a trading standpoint, we’ll favor fading weakness while below 6889- look to reduce short-exposure / possible price exhaustion on a move lower. Ultimately a break below yearly open support at 6705 would be needed to validate a larger turn in price.
NZD/USD TRADER SENTIMENT
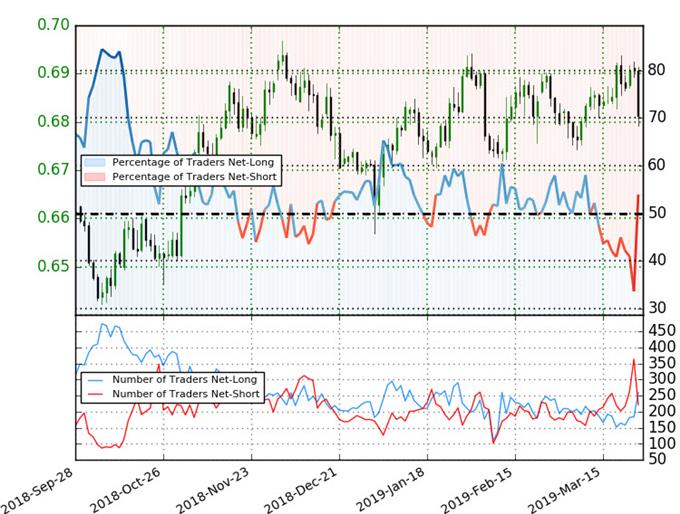
- A summary of IG Client Sentiment shows traders are net-long NZD/USD - the ratio stands at +1.17 (53.9% of traders are long) – weak bearish reading
- The percentage of traders net-long is now its highest since March 12th
- Long positions are46.1% higher than yesterday and 40.5% higher from last week
- Short positions are 23.7% lower than yesterday and 0.9% lower from last week
- We typically take a contrarian view to crowd sentiment, and the fact traders are net-long suggests Kiwi prices may continue to fall. Traders are further net-long than yesterday and last week, and the combination of current positioning and recent changes gives us a stronger NZD/USD-bearish contrarian trading bias from a sentiment standpoint.



Comments
Log in or sign up to join the conversation.