


After a mildly tumultuous week, let’s look at some key exchange traded funds.
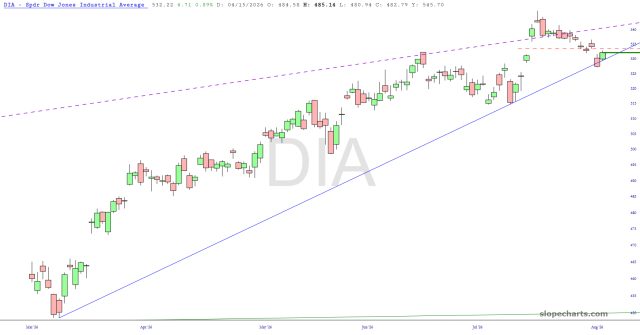
First up is the Dow 30 DIA, which has two interesting features: first, it broken its ascending trendline for the first time ever, causing it some much-needed damage, and second, it created a price gap between Wednesday and Thursday which presently represents important resistance.
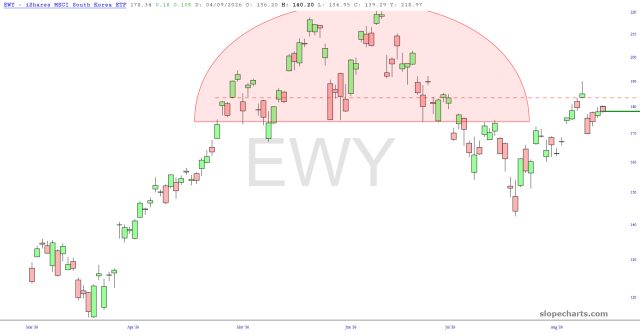
South Korea EWY is also sporting a price gap, this one between Monday and Tuesday. Its topping pattern (pink) has been somewhat violated, but it’s still relatively bearish. God willing, some renewed selling and NVDA will help pound this thing lower.
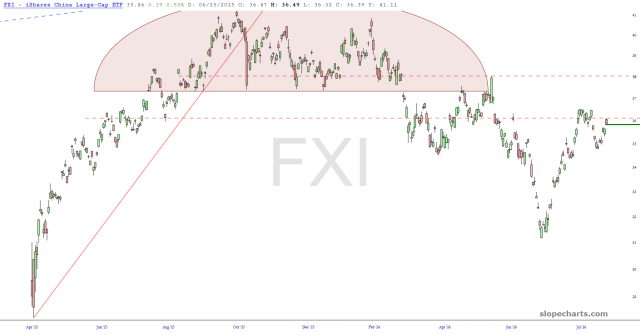
China FXI, my main options position, really needs to weaken at this point. it beautifully sealed its own price gap, but it’s seriously time for this beast to start breaking down if I want to stay with these puts.
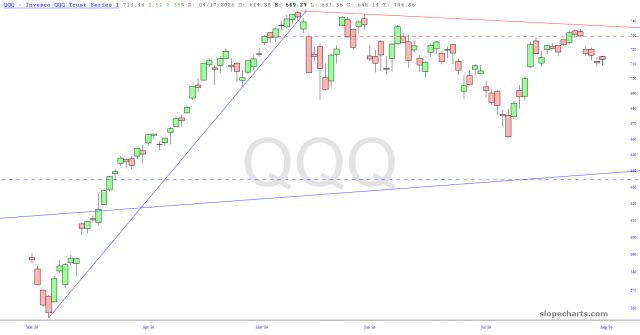
The Nasdaq QQQ was quite weak this week, relatively speaking, and its own price gap is anchored to Monday’s low price. This naturally path for this in the weeks to come is lower.
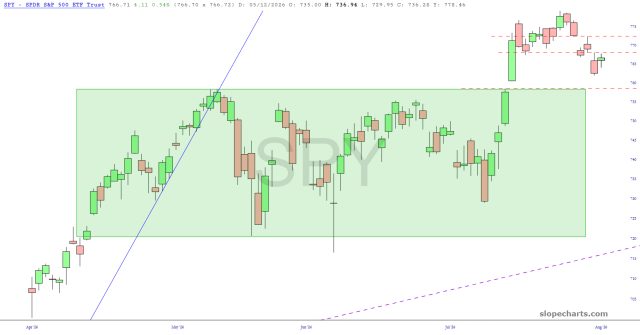
Finally, the S&P 500 SPY has two clean price gaps, one anchored to Monday’s low and the other anchored to Wednesday’s, and its next goal for any surviving bears is to cut below the key support represented by the dashed line at the top of that green rectangle.
My trading confidence is remarkably battered right now, which is probably the best bearish sign you can possibly have, and I have reduced my exposure to less than 100%.



Comments
Log in or sign up to join the conversation.