

Summary
- Most significant events facing the market call for lower yields . But there's pure upside momentum; bond investors scaring themselves. We will just have to accept that, and work-around it.
- The current rally in index futures meets significant resistance soon; that's when yields peak. We will use the changes in the 10yr yield to time exits from long equity trades.
- The Masters of the Universe (MOTUs) have started to buy long-end govies along with central banks, as Retail, CTAs, and Institutionals flee the long-dated market. MOTUs will win this one.
- The Treasury Cash Balance has started to fall with some velocity. The long-awaited TCB drawdown to less than $500 billion by end of June may have started. TCB will fall from $1.481 trillion today to less than $500 billion by end of June. Short term rates have already frontran the imminent sharp drawdown of the TCB until June. The TCB tends to lead Treasury Bill rates by about a week. The other significant thing is that the high frequency change rate of the TCB also impacts the high-frequency changes in the long bond yield. So we could just be days away from a top in the 10yr yield.
- G5 Central Banks took a breather in growing their Monetary Base about a year ago. That pause is just about to impact equities and bond yields in a big way. Hence, the spectacle of central banks making a grab for long duration US govies. If the predictive power of the changes in global Quantitative Easing regime continues to exert significant impact on global risk assets, we could see a pause in the rise of global equities and bond yields very soon, and that holds true until June this year. After that, the reflation process continues.
FEBRUARY 24, 2021
ippy04Feb 24, 2021 1:13 AM
Might be getting close to an interim peak in yields, though we could see 1.7+ later this year...
ippy04Feb 24, 2021 1:13 AM

TimK123Feb 24, 2021 5:07 AM
'Hidden' RSI divergence for ES - RSI flat but price dipping lower and lower, might be poised for a rebound. Really bullish potentially. I think we might be in a W1 still so could pull back tomorrow but not make new lows. I'll reflect in a couple of days whether this signal worked but usually it seems to be very robust indeed given a bit of time to play out. Seems like a spring being compressed to me, waiting for an excuse to burst out. Will see what happens.
TimK123Feb 24, 2021 5:07 AM

stephane.cFeb 24, 2021 10:28 AM
Either Nasdaq rockets back up or fundamentals deteriorate which is unlikely imho
I remain very constructive tech, the catalyst will be rates which will soon find a temporary ceiling and even retrace
 I find zillion reasons to be long Nasdaq, long LT bonds
If there is something fishy, will gain on my long bonds leg and lose on my long Nasdaq but this fall will be cushioned by decreasing long term rates which favor tech over the rest in the equity asset class

Russell 2000 is back up where it belongs in relation to S&P 500. The bulk of the rotation is behind us

GOOD AFTERNOON ASIA / GOOD EVENING WEST COAST
robert.p.balanModeratorLeaderOwnerFeb 24, 2021 5:22 AM
Have to modify some orders.
PAM SELLS 288 CONTRACTS ESH1 AT DOWNWARD BREACH OF 3865 AS SHORT OVERHEDGE FOR NQ LONG SCALPERS, GTC -
*Please modify:*
all PAM SELLS 288 CONTRACTS ESH1 AT DOWNWARD BREACH OF 3850 (FROM 3865) AS SHORT OVERHEDGE FOR NQ LONG SCALPERS, GTC - ALL FUNDS, INCL TRACKER AND EIGER
PAM SELLS 288 CONTRACTS NQH1 AT DOWNWARD BREACH OF 13,080 (FROM 12,880) AS SHORT HEDGE FOR NQ LONG SCALPERS, GTC
*Please modify:*
all PAM SELLS 288 CONTRACTS NQH1 AT DOWNWARD BREACH OF 13,000 (FROM 13,080) AS SHORT HEDGE FOR NQ LONG SCALPERS, GTC -- ALL FUNDS INCL TRACKER AND EIGER
robert.p.balanModeratorLeaderOwnerFeb 24, 2021 5:39 AM
all Please further modify the ES short hedge order's threshold from 3850 to 3840
all PAM SELLS ANOTHER 300 CONTRACTS ESH1 AT DOWNWARD BREACH OF 3840 (FROM 3865) AS SHORT HEDGE FOR RTY LONG OVERHEDGE, GTC - ALL FUNDS EXCLUDING TRACKER, EIGER
*We continue to get long YMH1 -- There should be a follow through to the upside-*
all PAM BUYS 288 CONTRACTS OF YMH1 AT BREACH OF 31,560, FOR ALL FUNDS, INCL TRACKER AND EIGER
robert.p.balanModeratorLeaderOwnerFeb 24, 2021 6:37 AM
all Please further modify the NQ short hedge order's threshold from 13,000 to 12,960
GOOD MORNING EUROPE / GOOD EVENING WEST COAST
robert.p.balanModeratorLeaderOwnerFeb 24, 2021 10:46 AM
*We add RTY scalpers to the long trade.*
all PAM BUYS 144 CONTRACTS OF RTYH1 AT BREACH OF 2,250 FOR ALL FUNDS, INCL TRACKER AND EIGER
robert.p.balanModeratorLeaderOwnerFeb 24, 2021 1:36 PM
PAM BUYS 144 CONTRACTS OF RTYH1 AT BREACH OF 2,250 FOR ALL FUNDS, INCL TRACKER AND EIGER
*This order was filled.*
*RTYH1 --- BOUGHT 144 CONTRACTS OF RTYH1 SCALPERS AT 2250.50 FOR ALL FUNDS, INCL TRACKER AND EIGER*
PAM BUYS 288 CONTRACTS OF YMH1 AT BREACH OF 31,560, FOR ALL FUNDS, INCL TRACKER AND EIGER
*This order was filled.*
*YMH1 -- DONE AT 31,563 BOUGHT 288 CONTRACT YMH1, FOR ALL FUNDS, INCL TRACKER AND EIGER*
robert.p.balanModeratorLeaderOwnerFeb 24, 2021 3:05 PM
PAM SELLS 288 CONTRACTS NQH1 AT DOWNWARD BREACH OF 13,000 (FROM 13,080) AS SHORT HEDGE FOR NQ LONG SCALPERS, GT
*Modify to:*
all PAM SELLS 288 CONTRACTS NQH1 AT DOWNWARD BREACH OF 12,920 (13,000) (FROM 13,080) AS SHORT HEDGE FOR NQ LONG SCALPERS, GTc -- ALL FUNDS
all Please further modify the ES short hedge order's threshold from 3840 to 3825 -- for 500 contracts of short hedges
vjapnFeb 24, 2021 3:20 PM
Robert, Can you think of an exogenous event that would get yields to continue to head even higher? They are clearly outside of the range of expectations.
robert.p.balanModeratorLeaderOwnerFeb 24, 2021 5:40 PM
All the significant events facing the market calls for lower yields -- but its pure momentum and bond investors scaring themselves. We will just have to accept that, and work around it.

robert.p.balanModeratorLeaderOwnerFeb 24, 2021 5:43 PM
This is our EWP schemata published yesterday. The red X is probably where the current yield is at.
So the current rally in index futures will meet significant resistance some time soon. That's probably when yields peak. So watch for a return of positive covariance between equities and yields. We will use the lead of the changes in the 10yr yield in exiting our long equity trades.
Meanwhile, we will have to chop up our trades, and given the potential swings in the yields, we can go long or short -- but you have to be extra alert. One member of the community failed to modify the hedge levels quick enough and was saddled with an unwanted short hedge, This is yet no time for B&H, and I am also thinking that the SPXL etf needs to be offloaded some time soon, And reset after a day or so, if we get lower levels.
robert.p.balanModeratorLeaderOwnerFeb 24, 2021 6:27 PM
This yield rise is unnerving, and it may just cause a flash crash in gold. We put in a short hedge to our long gold using exposure using the June contract which seems to have some reasonable liquidity.
all PAM SELLS 2,000 CONTRACTS GCM1 AT DOWNWARDS BREACH OF 1750, FOR ALL FUNDS, EXCEPT TRACKER AND EIGER
robert.p.balanModeratorLeaderOwnerFeb 24, 2021 6:51 PM
There is now enough daylight between current market and our long trade buy prices. We make sure we will not take a loss on these trades.
all PAM PUTS INITIAL TRAIL STOP TO LONG RTYH1 LONGS (BOT AT 2250.50) AT DOWNWARDS BREACH OF 2251 (BREAKEVEN), GTC -- ALL FUNDS, INCL TRACKER, EIGER
all PAM PUTS INITIAL TRAIL STOP TO LONG YMH1 LONGS (BOT AT 31,563) AT DOWNWARDS BREACH OF 31,600, GTC -- ALL FUNDS, INCL TRACKER, EIGER
all PLEASE MODIFY THE STOP THRESHOLD OF LONG RTY TO BREACH OF 2259 (FROM 2250).
Once/if we get a more sustained move higher, we will adjust the short hedge levels for NQ and RTY at higher levels. Hopefully, we can do this until we come close to the original long levels.
all PLEASE MODIFY THE STOP THRESHOLD OF LONG RTY TO BREACH OF 2265 (FROM 2259), GTC -- ALL FUNDS
all PLEASE MODIFY THE STOP THRESHOLD OF LONG YMH1 TO BREACH OF 31,700 (FROM 31,600).
robert.p.balanModeratorLeaderOwnerFeb 24, 2021 7:42 PM
all PLEASE MODIFY THE STOP THRESHOLD OF LONG YMH1 TO BREACH OF 31,780 (FROM 31,700). 2ND

robert.p.balanModeratorLeaderOwnerFeb 24, 2021 7:46 PM
When/if the 10yry yield decline reaches 1.285% -- that's probably the time we offload long indices and long ETFs.
If our trail stops are hit, we will just reset longs at lower levels.
Mr. TK's EWP schemata.

robert.p.balanModeratorLeaderOwnerFeb 24, 2021 8:07 PM
all PLEASE MODIFY THE STOP THRESHOLD OF LONG YMH1 TO BREACH OF 31,840 (31,780), GTC- 3rd
I have spoken with the XXX trading room teamleiter and he agreed to execute a special order -- buying more YM at downward breach of 1.3680 in the 10yr yield.
all PAM BUYS 300 CONTRACTS YMH1 AT BREACH OF 1.3680 IN THE 10YR YIELD, GTC -- ALL FUNDS INCL TRACKER, EIGER
Albert.FoodFeb 24, 2021 9:51 PM
Why are you buying on downward breach of yields? Isn't YM positively correlated with yields? Is it because equities will lag yields by a few days?
robert.p.balanModeratorLeaderOwnerFeb 24, 2021 10:02 PM
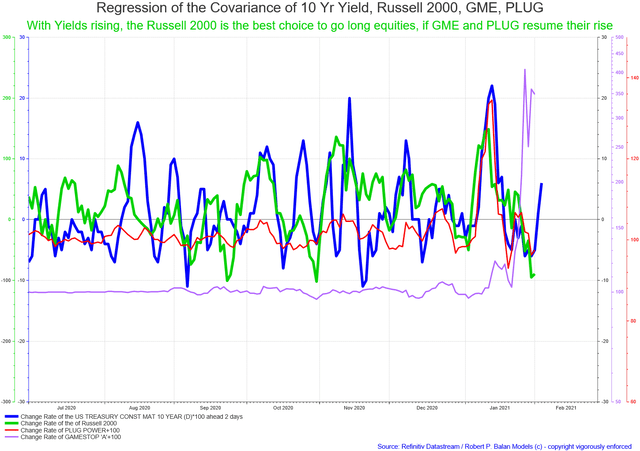
Mr. Food -- equities and yields have been negatively correlated for a week -- why did you think we saw a flash crash on equities?

THAT is what crashed equities, above.
And the yield sharp decline thereafter is what caused THIS, below.

Albert.FoodFeb 24, 2021 10:19 PM
I had no idea it could just flip. I thought positive was the true correlation but I also recall you showing us how over a certain level the correlation flips.
john.derFeb 24, 2021 10:19 PM
I've been long bonds and long equities for the past week. Ask me how I have been doing.
... luckily, thanks to position sizing and learning here how to trade around losing positions, I'm now up for the week. Not the easiest way to make money, though, lol.
centexlifeFeb 24, 2021 10:31 PM
PAM is a continuous learning experience. Keeping my chat (mouth) shut and absorbing (and gaining) daily. Over trading down. Over allocating down. Patience up. Earnings up. Gratitude off the chart.
kizunoFeb 24, 2021 11:16 PM
centexlife That is a great quotable Tex!
robert.p.balanModeratorLeaderOwnerFeb 24, 2021 10:31 PM
all PLEASE MODIFY THE STOP THRESHOLD OF LONG YMH1 TO BREACH OF 31,800 (FROM 31,840), GTC- 4TH
I can't watch the market 24 hour/day X 5, so I want to make sure, there is a little more wiggle room to accommodate any MOTU shenanigan while having a shut-eye.
See you in Asian trade. GN everyone.
FEBRUARY 25, 2021
GOOD MORNING EUROPE / GOOD EVENING WEST COAST
robert.p.balanModeratorLeaderOwnerFeb 25, 2021 8:15 AM
It was a non-event Asian trade for US equity indices, but the 10yr yield did a head fake again.

sparketFeb 25, 2021 3:31 AM
Huge head fake with the yield-equities reverse correction. Very surprising but also undeniable. I wonder if it’s merely a temporary phenomenon or more representative of a phase change as yields enter a new regime.
robert.p.balanModeratorLeaderOwnerFeb 25, 2021 8:17 AM
Fortunately, the equity futures ignored that sharp uptick in yields.
The Treasury Cash Balance has started to fall with some velocity. The long-awaited TCB drawdown to less than $500 billion by end of June may have started.

_TCB will fall from $1.481 trillion today to less than $500 billion by end of June._
_Short term rates have already frontran the imminent sharp drawdown of the TCB_
_The TCB tends to lead Treasury Bill rates by about a week_The other significant thing is that the high frequency change rate of the TCB also impacts the high-frequency changes in the long bond yield.So we could just be days away from a top in the 10yr yield.

What does that mean for equities?
robert.p.balanModeratorLeaderOwnerFeb 25, 2021 9:12 AM
What could be useful in determining the bond-equity relationship at this time is to see how these two asset classes performed at this time of the year. We may think of the markets as random in the very short term, but since systemic liquidity is the overriding factor in there future valuations, then the seasonality of liquidity flows has a strong bearing on what the underlying trend of these assets should be, at this time of the year.
It may be that the weird divergences we have been seeing in the equity-bond relationship in the past week are no more than divergence in the seasonality of these two major assets.

Even just eye-balling this seasonality chart of the 10Yr yield (above) shows that we may still have a few days left on the uptrend.

The seasonality construct of the SPX (above) is more variable at this time of the year. But there is a tendency to dip, the rally to a top within two weeks.These two charts provide historic performance, which of course is secondary to what the current prime movers are impacting on asset valuations.
robert.p.balanModeratorLeaderOwnerFeb 25, 2021 9:58 AM
The TCB is an important prime mover for assets. There are other interpretations of what TCB SHOULD DO to assets, but intensive work PAM and Alan Longbon has done on this liquidity source, shows that yields do fall when the TCB levels fall.
Mr. Alan Longbon has just DMed me and said:
_"Just a thought about this unseasonal upward move in rates. This could be a PD manipulation to get rates nice and high before they come zooming down as the TCB empties out. A chance to make a lot of money very cheaply for them. Push it up short term, take a position and then let the TCB gravity bring it down in the normal way."_
_"As you noted in the main chat the TCB dropped a lot yesterday, down $70B in a day. New bond issues below the redemption rate and the stock of treasuries is dropping as money is deleted overall."_
Very well said Herr Longbon -- it is not beneath the dignity of the MOTUs (they have none) to do that so as to screw the most people, in the most efficient way.
robert.p.balanModeratorLeaderOwnerFeb 25, 2021 10:10 AM
The Primary Dealers started accumulating long dated Treasuries, as central banks grab long-duration paper
Primary Dealers have been increasing long bond positions, even as long term rates surge higher (bond prices lower)
Meanwhile, Institutions, CTAs, and Retail have been offloading bond positions as rates surged higher (bond prices fell)
_Note that the action of the Primary Dealers is exactly the opposite of what Institutions, CTAs and Retail do_

wisesunFeb 25, 2021 10:32 AM
MOTUs are Primarily Dealers? I had mistaken Institutions & CTAs as MOTUs. T_T
robert.p.balanFeb 25, 2021 10:33 AM
PDs and other Inv Bank hangers on that are not PDs -- those are the MOTUs.robert.p.balanModeratorLeaderOwnerFeb 25, 2021 10:37 AMFor one thing the G5 global central banks understand the impact of the growth and decline of their balance sheets.
That said, the G5 CBs took a breather in growing their Monetary Base about a year ago. That pause is just about to impact equities and bond yields in a big way (Herr Alan Longbon's fave chart). Hence, the spectacle of central banks making a grab for long duration US govies.
The Masters of the Universe (MOTUs) understand this too.
If the predictive power of the changes in global Quantitative Easing regime continues to exert significant impact on global risk assets, we could see a pause in the rise of global equities and bond yields very soon, and that holds true until June this year.
After that, the reflation process continues.

stephane.cFeb 25, 2021 12:50 PM
Hi Robert, do you expect oil to retrace until June after this rocket move?
robert.p.balanModeratorLeaderOwnerFeb 25, 2021 1:03 PM

I am expecting oil prices to collapse any day now, SC.
(To be finalized after NY close today, Thursday, February 25)
------------------------------------------------------------------------------------
----------------------------------------------------------------------------------------
Here is the current status of the PAM flagship Swing Fund, which includes open and closed trades.
During the twelve months of 2020, PAM delivered phenomenal real-dollar Hedge Fund trading performance, the best at Seeking Alpha:
PAM's flagship Swing Portfolio, year-to-date (December 31, 2020) delivered $100, 181,522.77 net profit on $11,172,813 margin capital.
Year-to-date performance: 860.27%, on 888-98 win-loss trades.

Comments
Log in or sign up to join the conversation.