

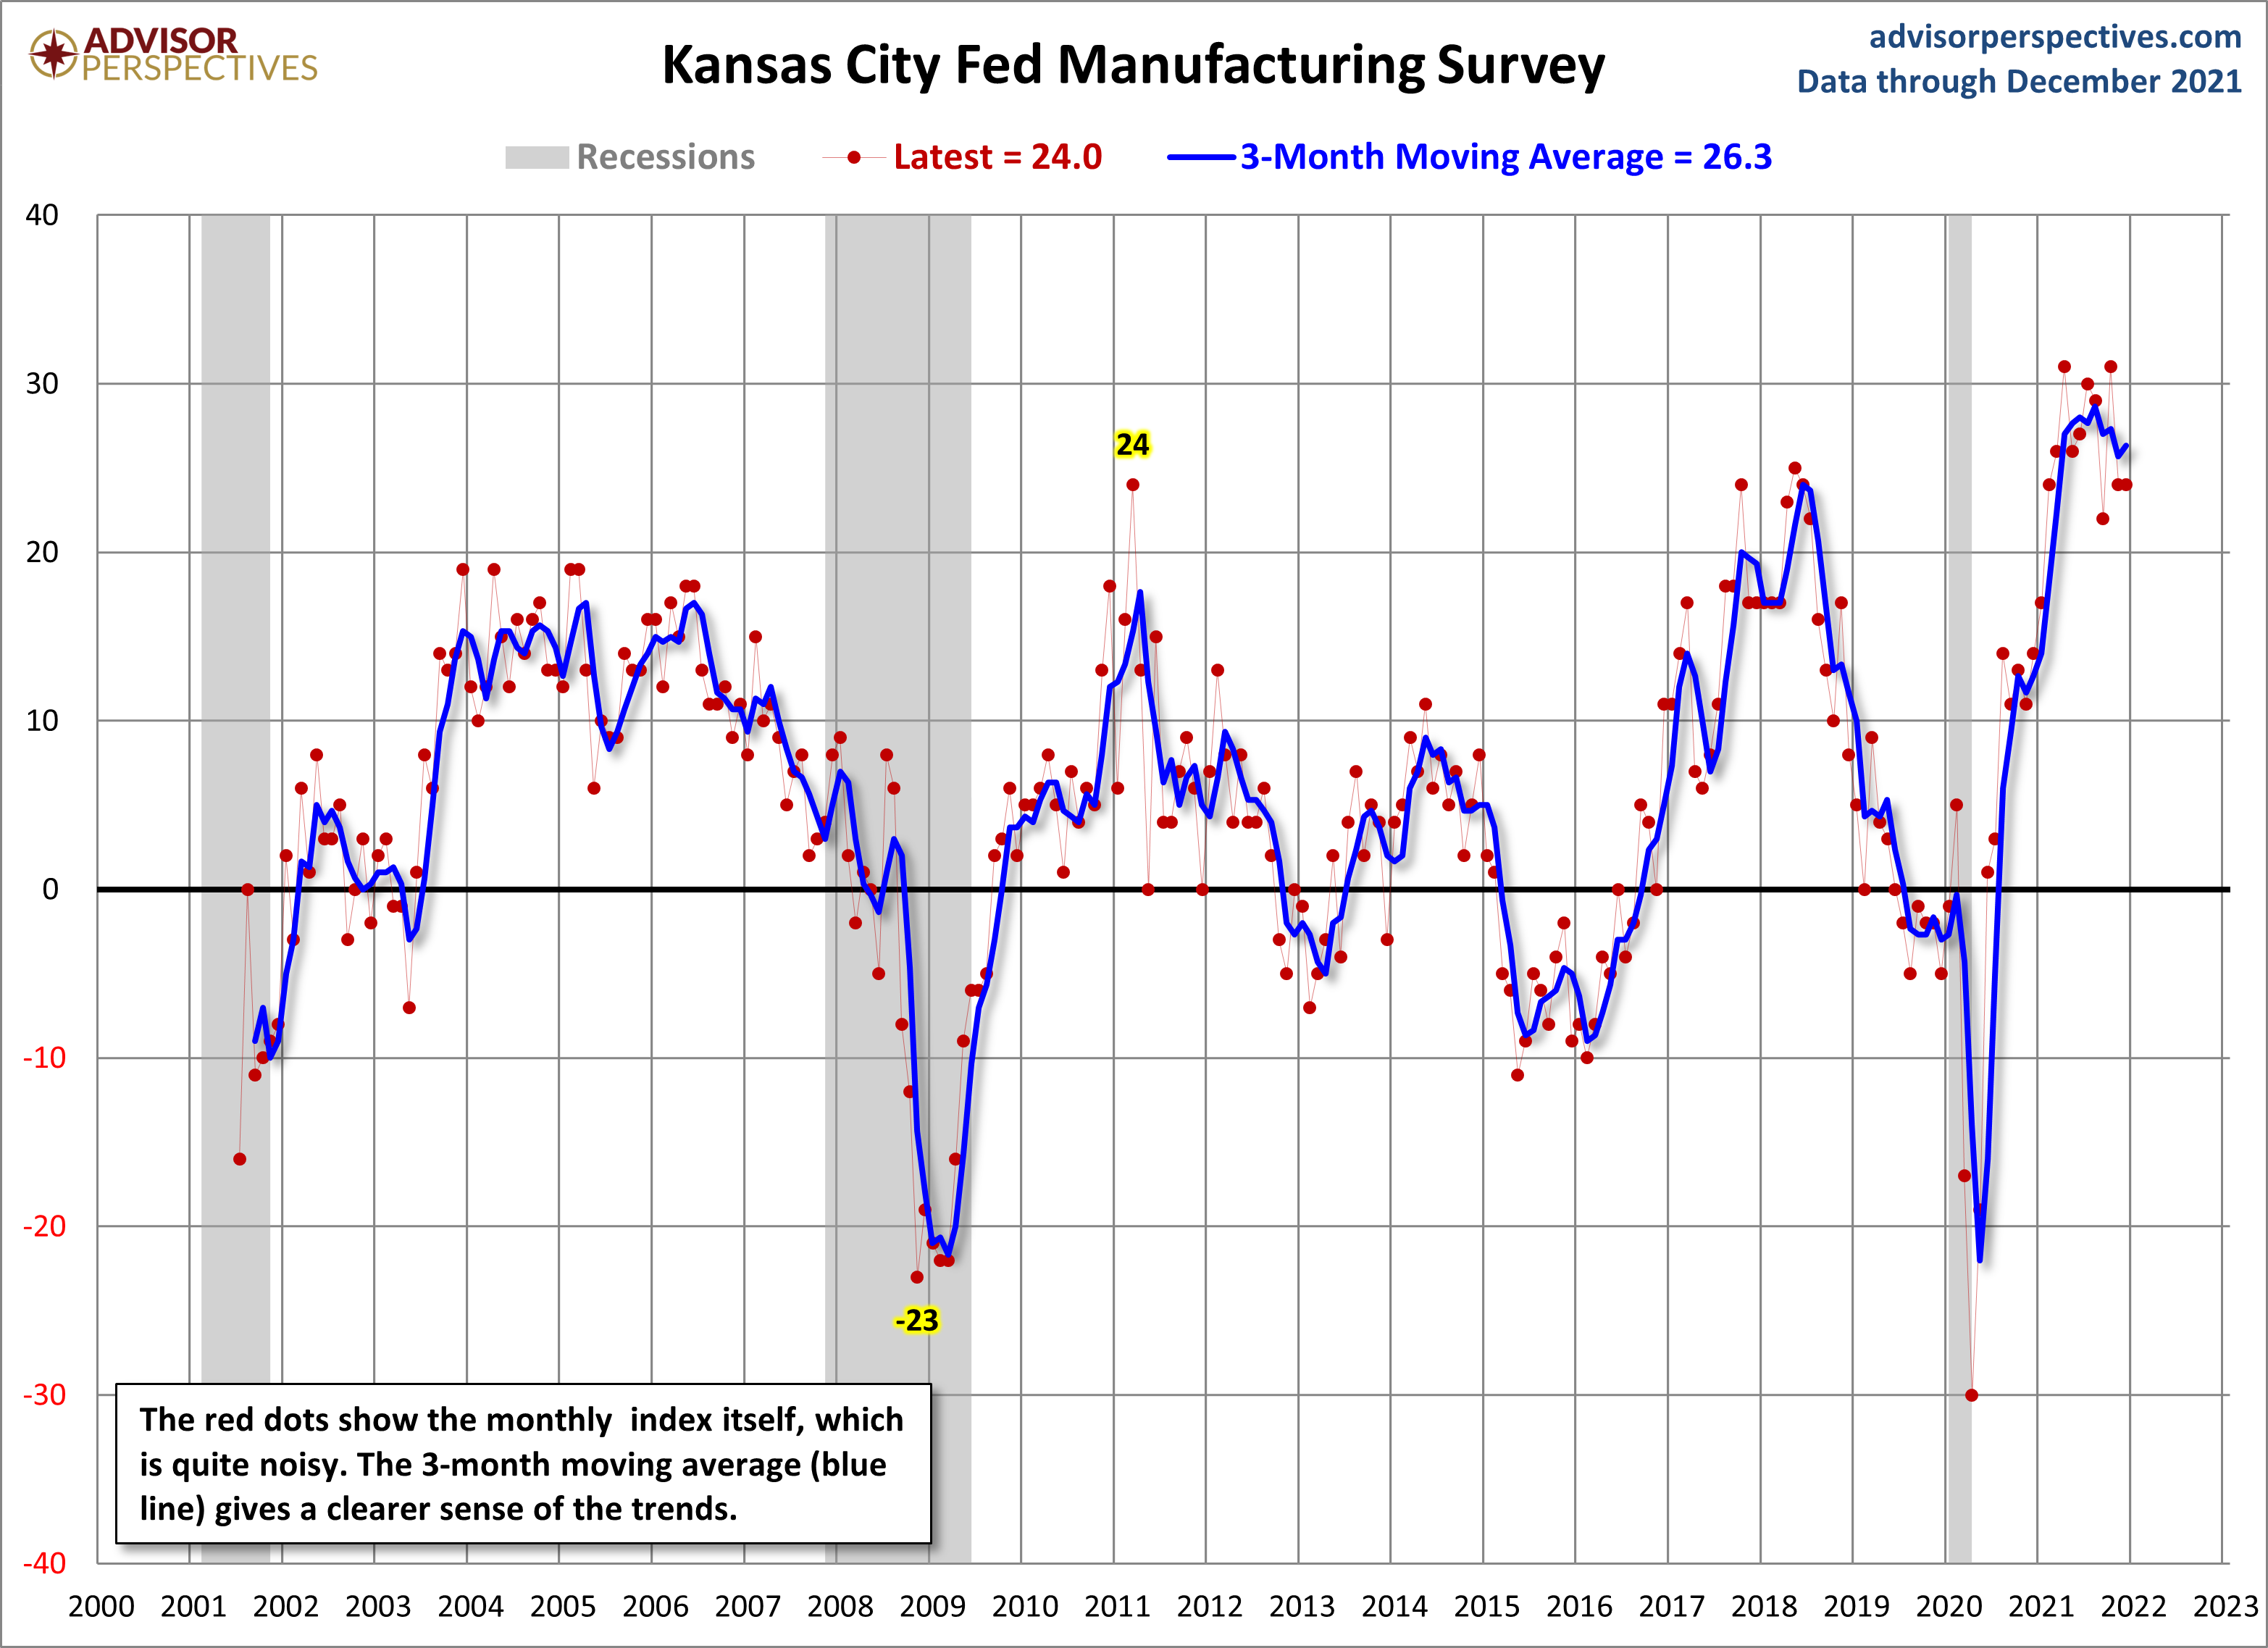
The latest index came in at 24, unchanged from last, indicating steady continued expansion in December. The future outlook dropped to 25. Here is a snapshot of the complete Kansas City Fed Manufacturing Survey.
Quarterly data for this indicator dates back to 1995, but monthly data is only available from 2001.
Here is an excerpt from the latest report:
Tenth District manufacturing activity growth edged higher, but expectations for future activity moderated slightly (Chart 1, Tables 1 & 2). The monthly index of raw materials prices continued to ease slightly from a month ago, although most firms continued to report higher input prices compared to a year ago. Finished goods price indexes declined from a month ago but were also above year ago levels for most firms. Expectations for future raw materials prices rose, and a significant share of district manufacturing firms still expected finished goods prices to increase over the next six months. [Full report here]
Here is a snapshot of the complete Kansas City Fed Manufacturing Survey.
(Click on image to enlarge)
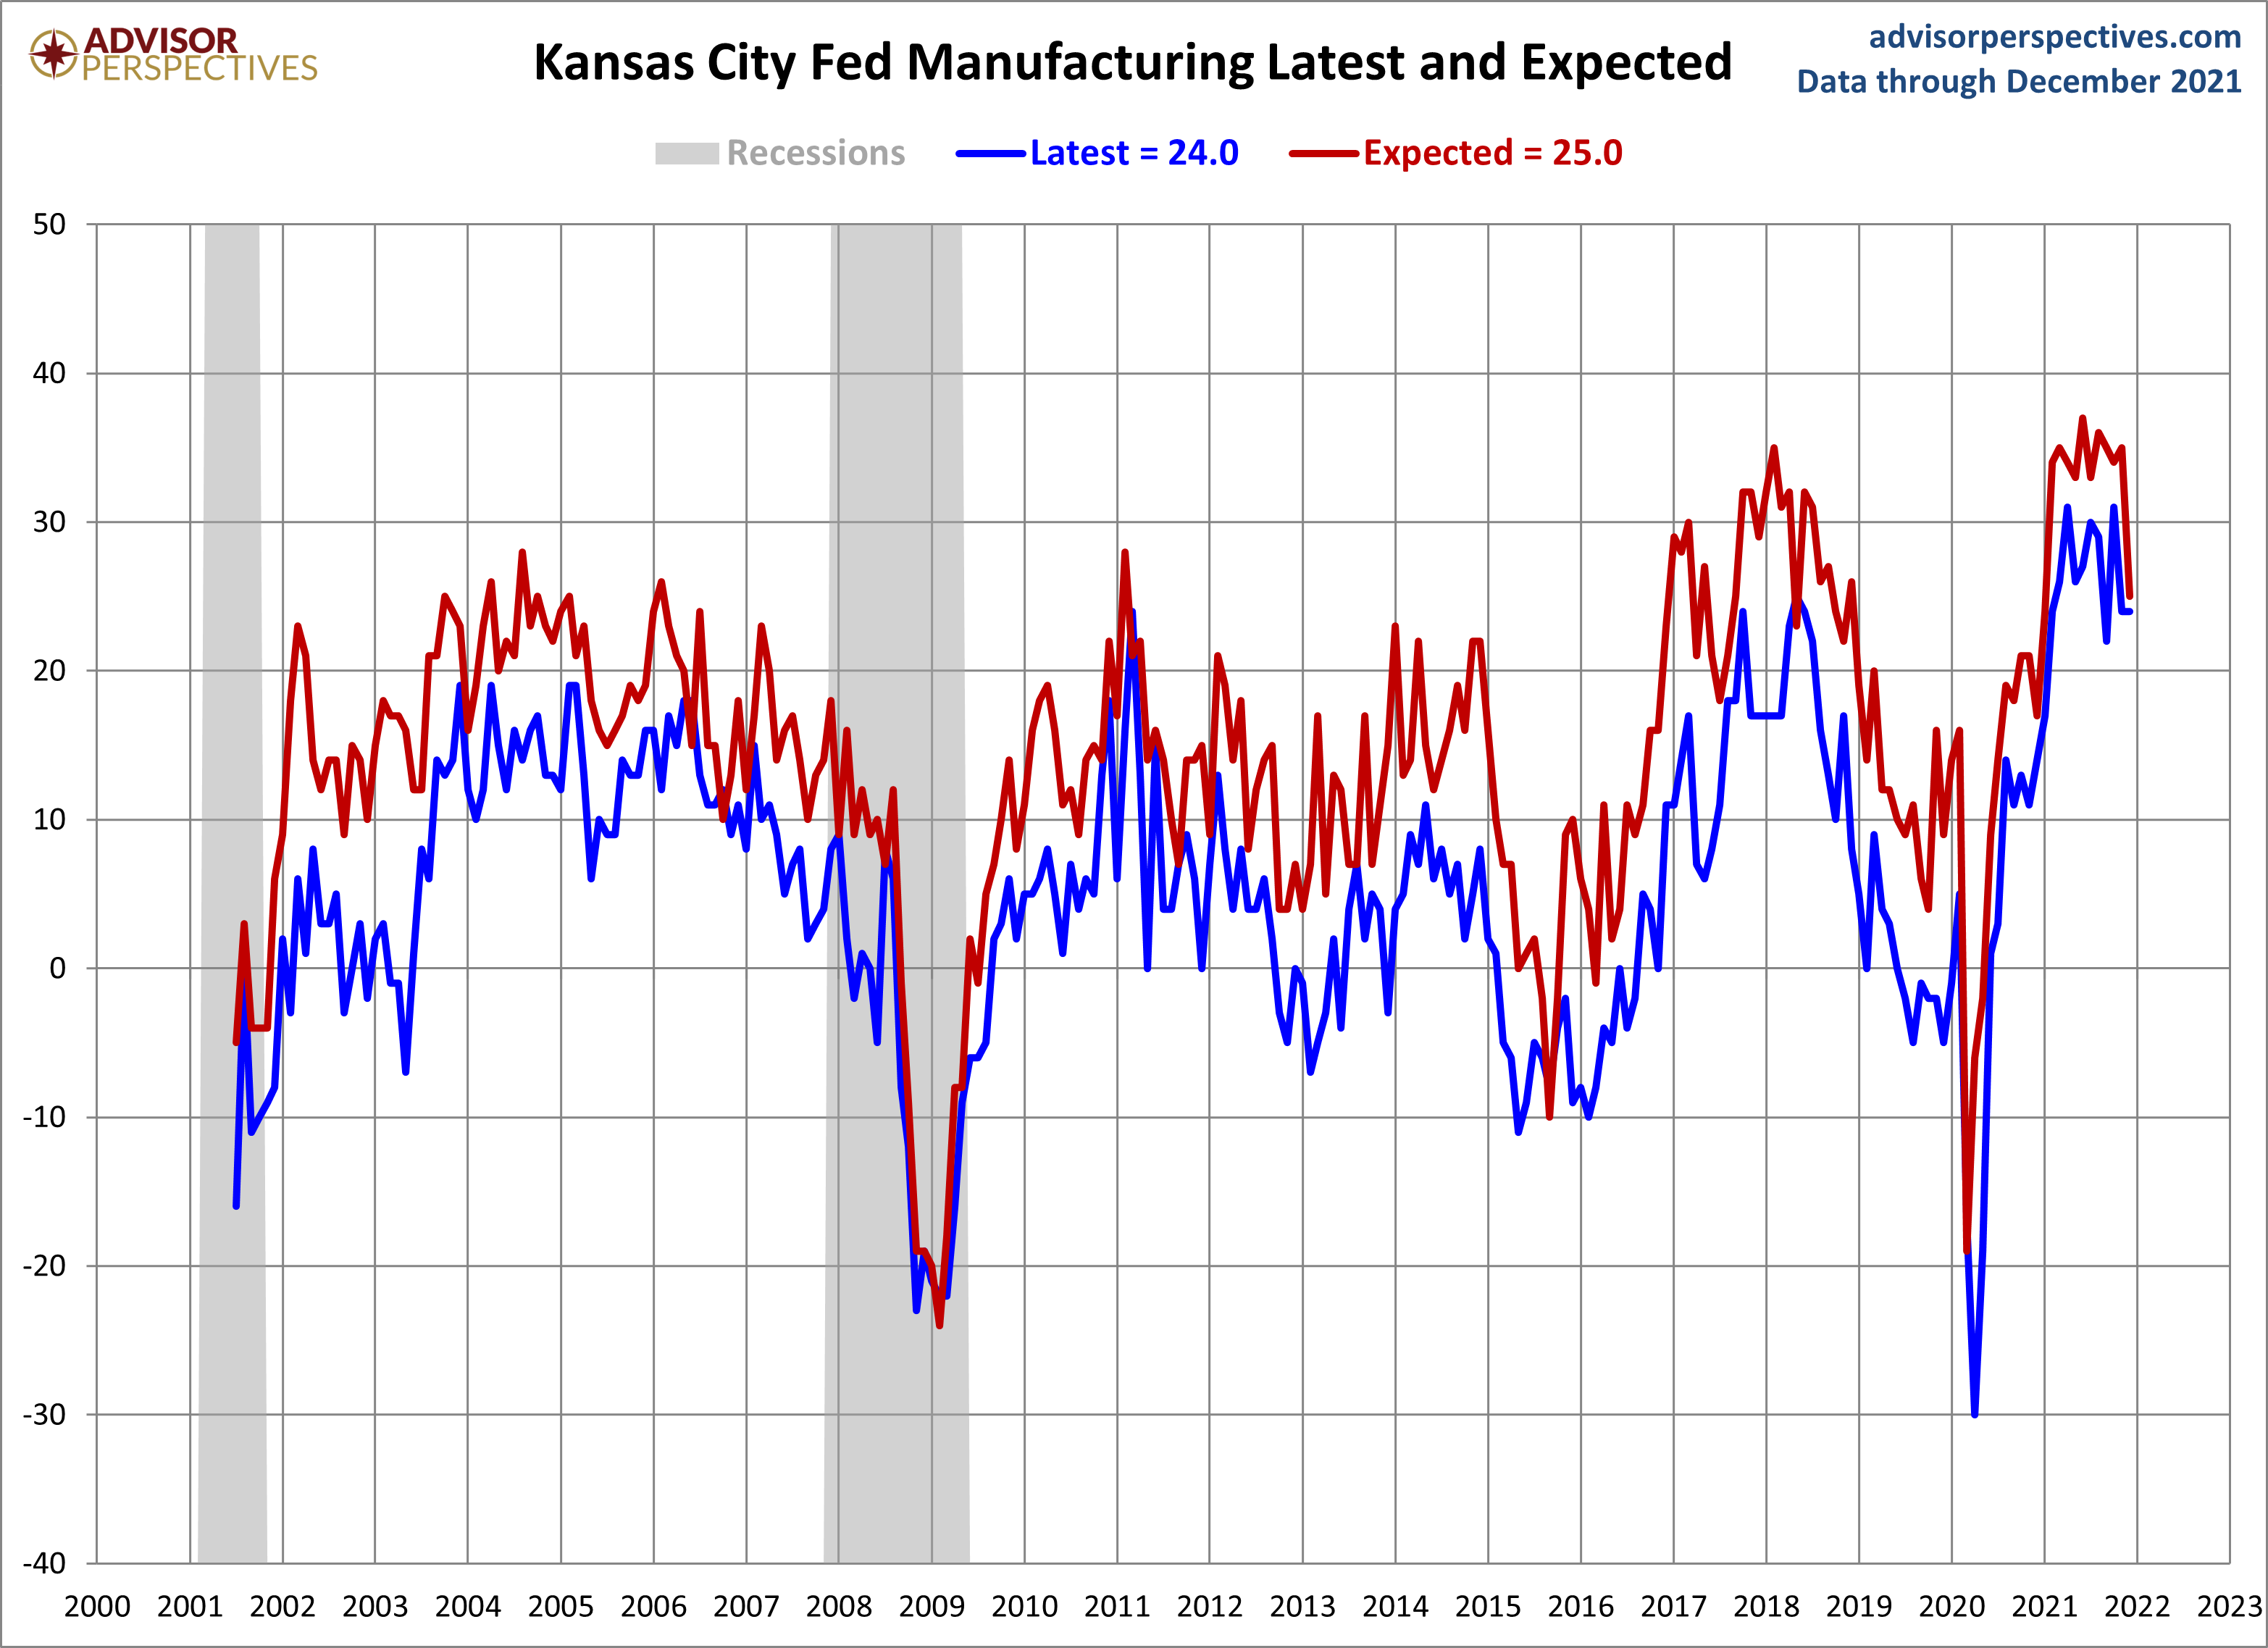
The next chart is an overlay of the general and future outlook indexes — the outlook six months ahead. Future factory indexes dropped to 25.
(Click on image to enlarge)
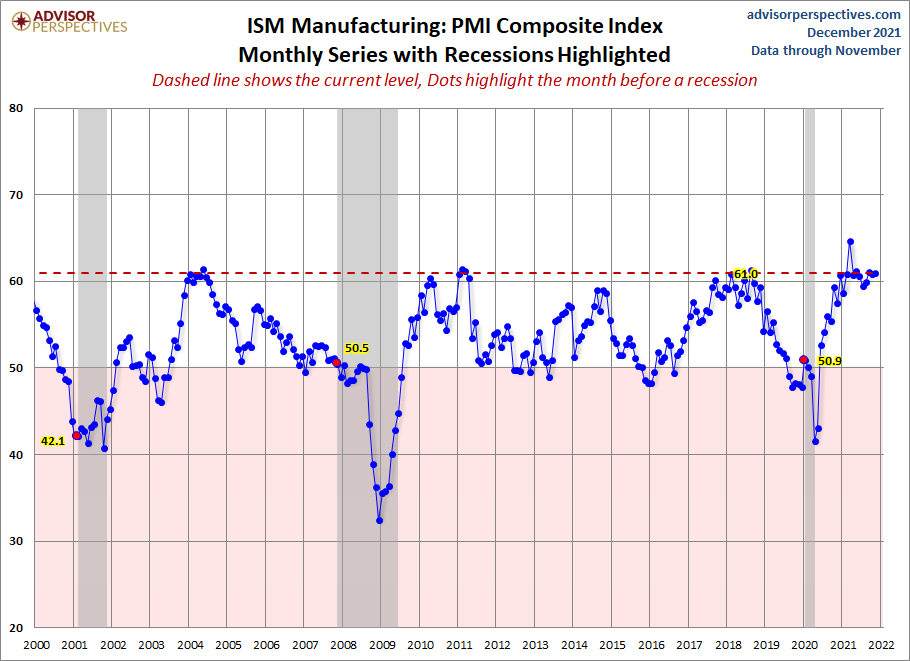
For comparison, here is the latest ISM Manufacturing survey.
(Click on image to enlarge)
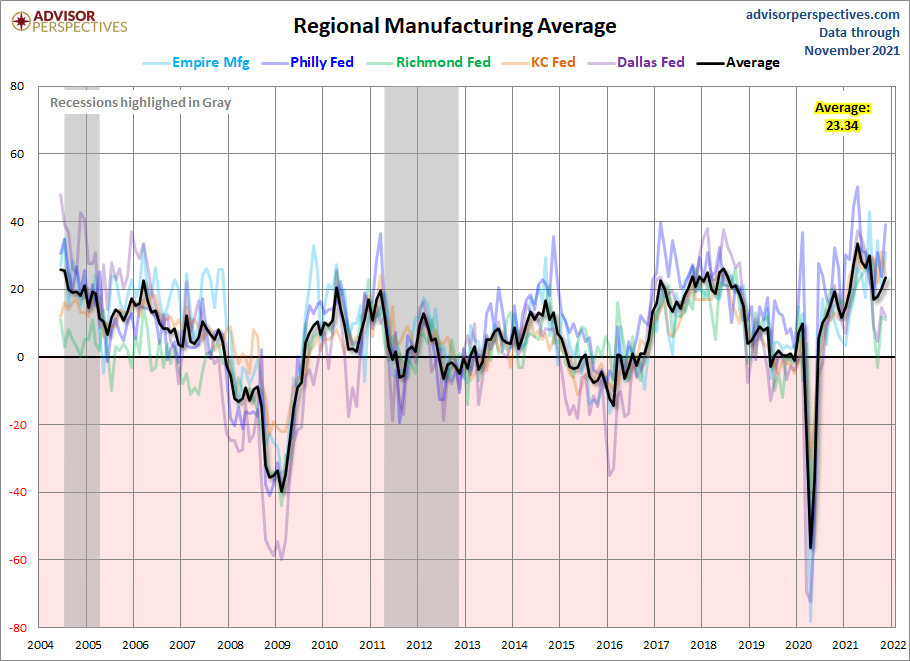
Let's compare all five Regional Manufacturing indicators. Here is a three-month moving average overlay of each since 2001 (for those with data).
(Click on image to enlarge)
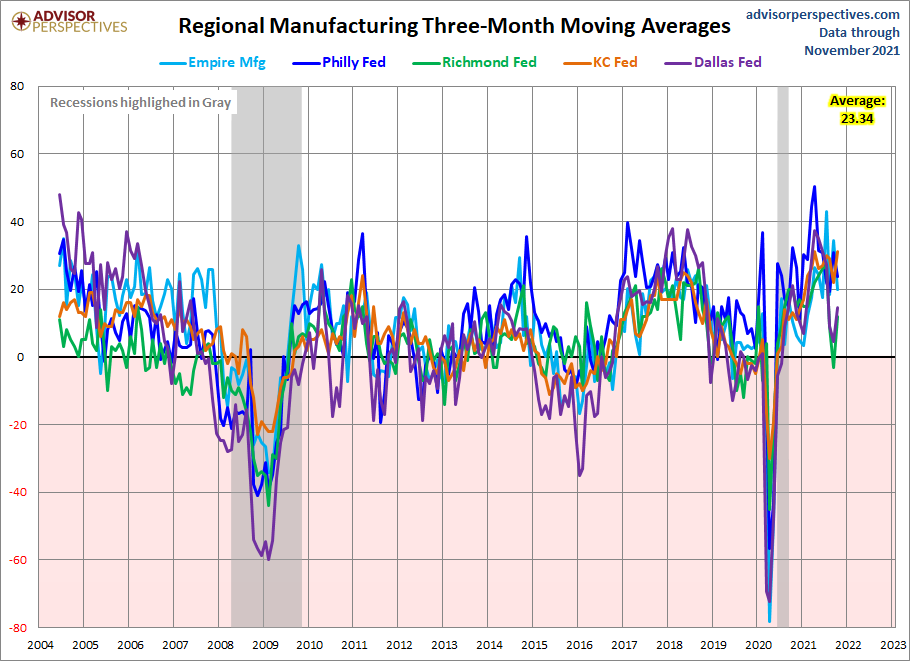
Here is the same chart including the average of the five.
(Click on image to enlarge)



Comments
Log in or sign up to join the conversation.