

Image Source: Pexels
Civilian employment adjusted to NFP concept, manufacturing production, real retail sales, ADP’s private NFP, and BTS freight services index. The sole exception is the Philadelphia Fed coincident index, based on labor indicators.
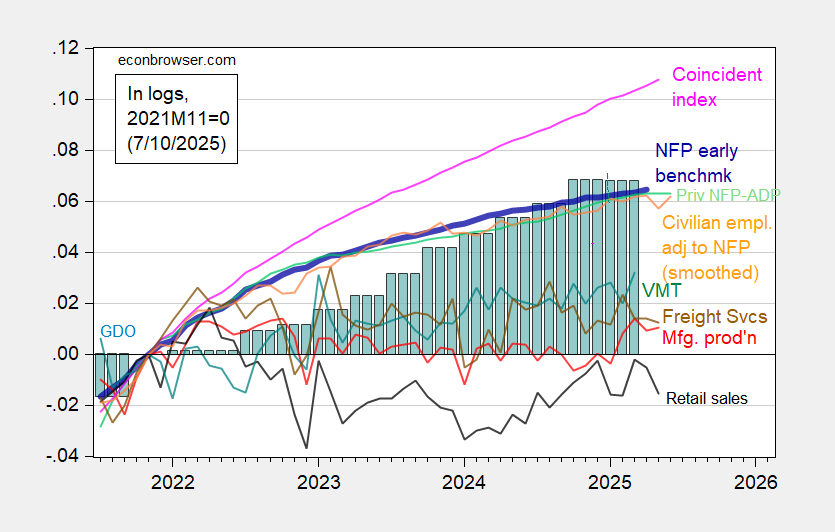
Figure 1: Implied Nonfarm Payroll early benchmark (NFP) (bold blue), civilian employment adjusted smoothed population controls adjusted to NFP concept (orange), manufacturing production (red), private NFP (ADP) (light green), real retail sales (black), vehicle miles traveled (brown), and coincident index in Ch.2017$ (pink), GDO (teal bars), all log normalized to 2021M11=0. Source: Philadelphia Fed [1], Philadelphia Fed [2], Census, ADP, Federal Reserve, BTS via FRED, BLS, BEA 2025Q1 third release, and author’s calculations.
Note that every NBER BCDC indicator for May is down — including SPGMI’s monthly GDP, as shown in this post.
More By This Author:
GDP Impact Of 87.5k Removals/YrWhen “Liberation Day” Replaces “Infrastructure Week” Replaces “Groundhog Day” ™…
Business Fixed Investment Ex-IIP And Policy Uncertainty


Comments
Log in or sign up to join the conversation.