


Of the three regional manufacturing surveys released for June, all are in expansion.
There were no market expectations reported from Bloomberg - and the reported value was +2. Any value below zero is contraction.

z kansas_man.PNG
The Federal Reserve Bank of Kansas City released the June Manufacturing Survey today. According to Megan Williams, survey manager and associate economist at the Federal Reserve Bank of Kansas City, the survey revealed that Tenth District manufacturing activity increased slightly.
"Regional factory activity posted a positive reading for the first time since January 2015, as energy prices have stabilized somewhat and orders have increased," said Williams. "Additionally, firms continue to expect further improvements for the months ahead."
TENTH DISTRICT MANUFACTURING SUMMARY
Tenth District manufacturing activity increased slightly, posting a positive reading for the first time in eighteen months. Expectations for future activity remained generally solid, and most price indexes rose modestly
The month-over-month composite index was 2 in June, up from -5 in May and -4 in April (Tables 1 & 2, Chart). The composite index is an average of the production, new orders, employment, supplier delivery time, and raw materials inventory indexes. The improvement came from both durable and nondurable goods-producing plants, particularly aircraft, food, plastics, and electronic equipment. Most month-over-month indexes increased markedly. The production index jumped from -11 to 12, and the shipments, news orders, and order backlog indexes also rose considerably. The employment index edged up from -13 to -4, its highest level in over a year. The finished goods inventory index edged up from -12 to -5, while the raw materials inventory index was unchanged.
Year-over-year factory indexes improved moderately but remained negative. The composite year-over-year index was rose from -19 to -15, and the production, shipments, new orders, order backlog, and employment indexes also increased slightly. The capital spending index improved from -15 to -3, its highest level in seven months. The raw materials inventory index fell from -15 to -22, while the finished goods inventory index inched higher.index improved slightly from -26 to -24, and the capital expenditures index also edged higher. The new orders for exports index moved up from -19 to -15, and both inventory indexes increased modestly
Summary of all Federal Reserve Districts Manufacturing:
Richmond Fed (hyperlink to reports):

z richmond_man.PNG
Kansas Fed (hyperlink to reports):

z kansas_man.PNG
Dallas Fed (hyperlink to reports):

z dallas_man.PNG
Philly Fed (hyperlink to reports):

z philly fed1.PNG
New York Fed (hyperlink to reports):

z empire1.PNG
Federal Reserve Industrial Production - Actual Data (hyperlink to report):
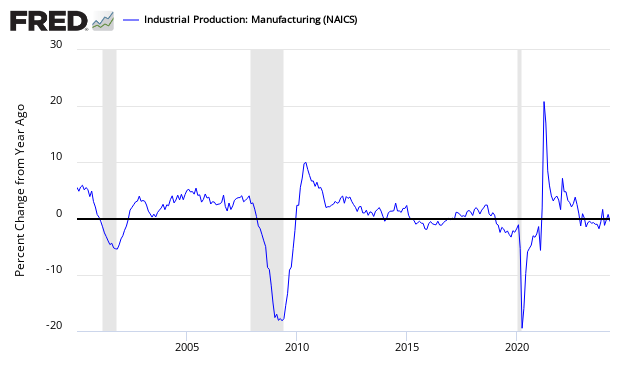
Holding this and other survey's Econintersect follows accountable for their predictions, the following graph compares the hard data from Industrial Products manufacturing subindex (dark blue bar) and US Census manufacturing shipments (lighter blue bar) to the Kansas City Fed survey (light green bar).
Comparing Surveys to Hard Data:

z survey1.png
In the above graphic, hard data is the long bars, and surveys are the short bars. The arrows on the left side are the key to growth or contraction.


Comments
Log in or sign up to join the conversation.