

Written by Doug Short and Steven Hansen
The Conference Board Consumer Confidence Index improved to 98.0 in June from the May final reading of 92.4. The market expected (from Bloomberg) this index to come in between 90.8 to 95.5 (consensus 93.3).

Note that this data is considered preliminary, and the cutoff for these results was 16 June 2016.
Here is an excerpt from The Conference Board:
The Conference Board Consumer Confidence Index®, which had decreased in May, improved in June. The Index now stands at 98.0 (1985=100), up from 92.4 in May. The Present Situation Index increased from 113.2 to 118.3, while the Expectations Index rose from 78.5 to 84.5 in June.
"Consumer confidence rebounded in June, after declining in May," said Lynn Franco, Director of Economic Indicators at The Conference Board. "Consumers were less negative about current business and labor market conditions, but only moderately more positive, suggesting no deterioration in economic conditions, but no strengthening either. Expectations regarding business and labor market conditions, as well as personal income prospects, improved moderately. Overall, consumers remain cautiously optimistic about economic growth in the short-term."
Consumers' appraisal of current conditions improved in June. Those stating business conditions are "good" increased slightly from 26.1 percent to 26.9 percent, while those saying business conditions are "bad" decreased from 21.4 percent to 17.7 percent. Consumers' assessment of the labor market was mixed. Those claiming jobs are "plentiful" declined from 24.5 percent to 23.4 percent, however those claiming jobs are "hard to get" also decreased from 24.5 percent to 23.3 percent.
Consumers' optimism regarding the short-term outlook improved in June. Those expecting business conditions to improve over the next six months increased from 15.0 percent to 16.8 percent, while those expecting business conditions to worsen decreased slightly, from 11.7 percent to 11.4 percent.
Consumers' outlook for the labor market was more favorable than last month. The percentage anticipating more jobs in the months ahead increased from 12.5 percent to 14.2 percent, while those anticipating fewer jobs decreased marginally from 18.2 percent to 17.9 percent. The proportion of consumers expecting their incomes to increase improved from 16.5 percent to 18.2 percent, while the proportion expecting a reduction edged down from 12.6 percent to 11.5 percent.
Putting the Latest Number in Context
The chart below is another attempt to evaluate the historical context for this index as a coincident indicator of the economy. Toward this end we have highlighted recessions and included GDP. The regression through the index data shows the long-term trend and highlights the extreme volatility of this indicator. Statisticians may assign little significance to a regression through this sort of data. But the slope resembles the regression trend for real GDP shown below, and it is a more revealing gauge of relative confidence than the 1985 level of 100 that the Conference Board cites as a point of reference.
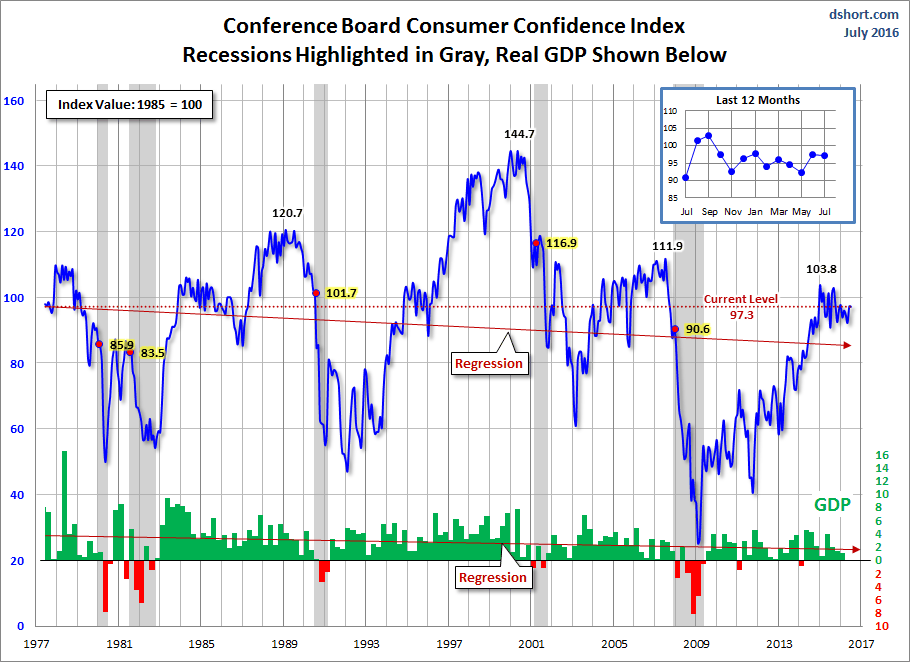
On a percentile basis, the latest reading is at the 57% level of all the monthly data points since June 1977. That's an increase from 45% previous month.
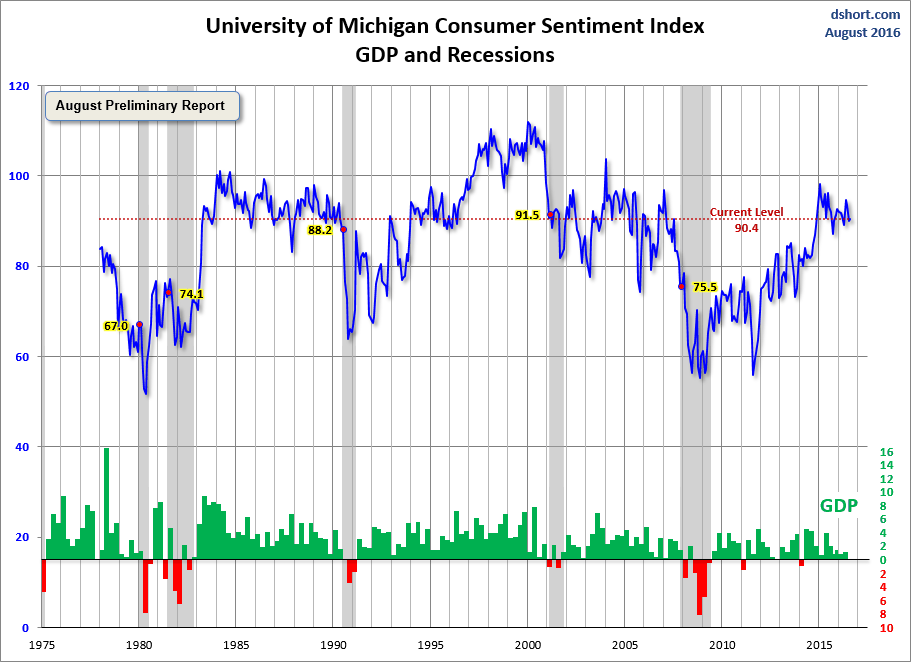
For an additional perspective on consumer attitudes, see the most recent Reuters/University of Michigan Consumer Sentiment Index. Here is the chart from that post.
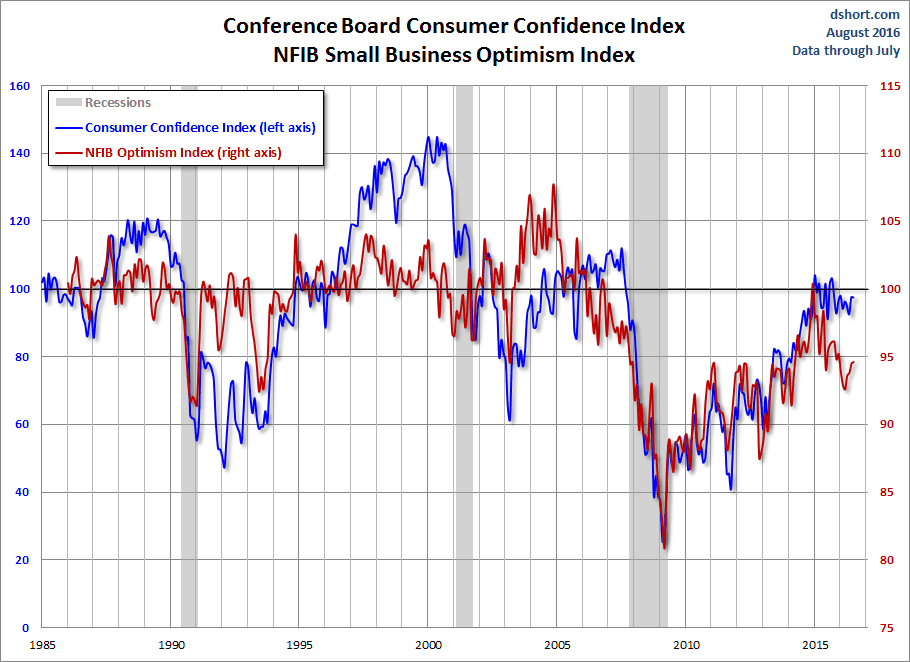
And finally, let's take a look at the correlation between consumer confidence and small business sentiment, the latter by way of the National Federation of Independent Business (NFIB) Small Business Optimism Index. As the chart illustrates, the two have tracked one another fairly closely since the onset of the Financial Crisis.
Caveats in Using the Conference Board's Consumer Confidence Index
According to Bloomberg, the following caveat is provided when reviewing this series:
The underlying series for "planned purchases" (autos, homes, and major appliances) and "vacation intentions" showed larger increases in November 2010 levels, primarily due to sample design differences. These level shifts will be treated as breaks, and there will be no historial revisions. Neither series is included in or has any impact on the Consumer Confidence Index.The switch to the Census X-12 seasonal adjustment program produced only minor differences for both levels and month-to-month changes. As a result, The Conference Board did not find it necessary to undertake a full historical revision of the CCI time series based on the seasonal adjustment method. The restated data for November 2010, December 2010 and January 2011 (preliminary data) are based on the prior seasonal adjustment method. This index is an average of responses to the following questions: 1. Respondents appraisal of current business conditions. 2. Respondents expectations regarding business conditions six months hence. 3. Respondents appraisal of the current employment conditions. 4. Respondents expectations regarding employment conditions six months hence. 5. Respondents expectations regarding their total family income six months hence. For each of the 5 questions, there are three response options: Postive, Negative and Neutral. The response proportions to each question are seasonally adjusted. For each of the five question (above), the POSITIVE figure is divided by the sum of the POSITIVE and NEGATIVE to yield a proportion, which we call the 'RELATIVE' value. For each question, the average RELATIVE for the calendar year 1985 is then used as a benchmark to yield the INDEX value for that question. From 1967 to mid 1977 the CCI was bi-monthly.
This is a survey based on a probability-design random sample - conducted for The Conference Board by Nielsen. Surveys are a quantification of opinion rather than facts and data.
Observers of consumer sentiment polls should be aware they are imperfect quantifications of opinion. The question arises whether they are a rear view window or a forward looking indicator - or possibly a little of each. There is little question, however, that poor consumer sentiment corresponds to poor economic performance. Econintersect believes that consumer sentiment is mostly a coincident or lagging economic indicator.


Comments
Log in or sign up to join the conversation.