

The Philly Fed Business Outlook Survey significantly improved. Key elements remained in positive territory.
Analyst Opinion of the Philly Fed Business Outlook Survey
Although the survey index significantly improved, the key element sales were mixed. Overall, I do not consider this survey much better than last month.
This is a very noisy index which readers should be reminded is sentiment based. The Philly Fed historically is one of the more negative of all the Fed manufacturing surveys but has been more positive than the others recently.
The index moved from +0.3 to +21.8. Positive numbers indicate market expansion, negative numbers indicate contraction. The market expected (from Econoday) 2.0 to 5.0 (consensus +4.5).
Manufacturing conditions in the region showed improvement this month, according to firms responding to the July Manufacturing Business Outlook Survey. The survey's indexes for general activity, new orders, shipments, and employment remained positive and increased from their June readings. Most of the survey's future activity indexes increased, suggesting improved optimism about growth for the next six months.
Current Indicators Suggest Growth
The diffusion index for current general activity more than recovered from its decline last month, increasing from 0.3 in June to 21.8 this month (see Chart 1). The indexes for current shipments and new orders also improved this month: The current new orders index increased 11 points, while the shipments index increased 8 points.

Econintersect believes the important elements of this survey are new orders and unfilled orders. New orders significantly improved and remain in expansion whilst unfilled orders declined and is barely in expansion.

This index has many false recession warnings.
Summary of all Federal Reserve Districts Manufacturing:
Richmond Fed (hyperlink to reports):

Kansas Fed (hyperlink to reports):

Dallas Fed (hyperlink to reports):

New York Fed (hyperlink to reports):

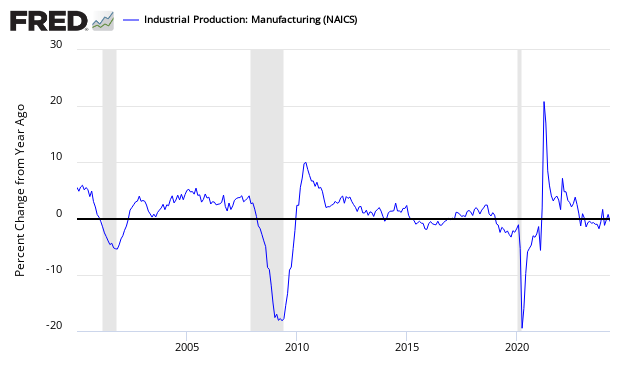
Federal Reserve Industrial Production - Actual Data (hyperlink to report):
Holding this and other survey's Econintersect follows accountable for their predictions, the following graph compares the hard data from Industrial Products manufacturing subindex (dark blue bar) and US Census manufacturing shipments (red bar) to the Philly Fed survey (yellow bar).

In the above graphic, hard data is the long bars, and surveys are the short bars. The arrows on the left side are the key to growth or contraction.
Caveats on the use of the Philly Fed Business Outlook Survey:
This is a survey, a quantification of opinion - not facts and data. Surveys lead hard data by weeks to months and can provide early insight into changing conditions. Econintersect finds they do not necessarily end up being consistent compared to hard economic data that comes later, and can miss economic turning points.
This survey is very noisy - and recently showed recessionary conditions. And it is understood from 3Q2011 GDP that the economy was expanding even though this index was in contraction territory. On the positive side, it hit the start and finish of the 2007 recession exactly.
No survey is accurate in projecting employment - and the Philly Fed Business Outlook Survey is no exception. Although there are some general correlation in trends, month-to-month movements have not correlated with the BLS Service Sector Employment data.
Over time, there is a general correlation with real business data - but month-to-month conflicts are frequent.


Comments
Log in or sign up to join the conversation.