


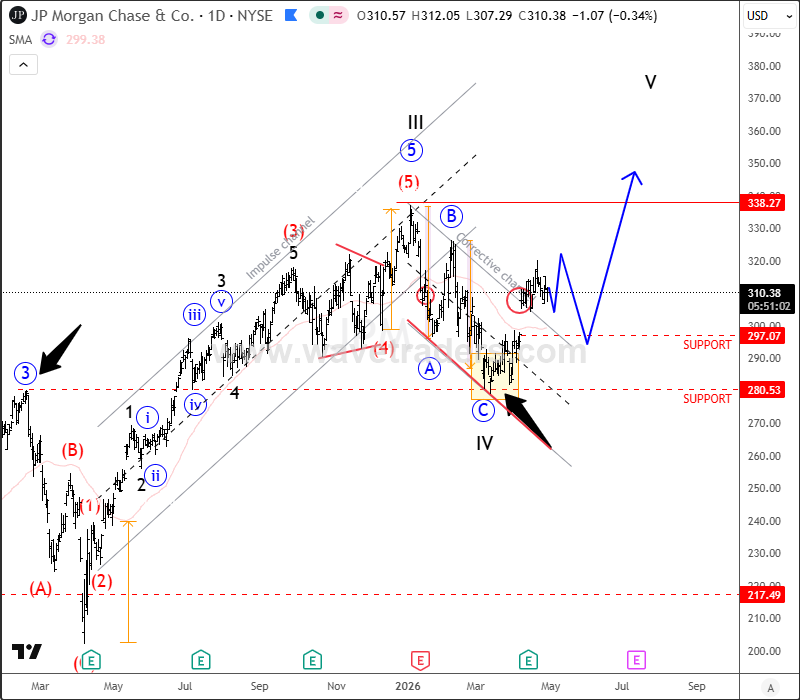
Back on April 29, we discussed JPMorgan and highlighted the potential for a corrective decline before the broader bullish trend could resume. Since then, the stock has followed that scenario nicely, completing an A-B-C drop into important support around the 280 area, which also marked the February high. CHECK IT HERE
That was where the market stabilized, and we can now see a strong push higher, extending toward the 161.8% Fibonacci level and confirming impulsive, third-wave price action. The broader recovery within black wave V therefore appears to be ongoing and incomplete, suggesting that more gains could be ahead after the current corrective pause.
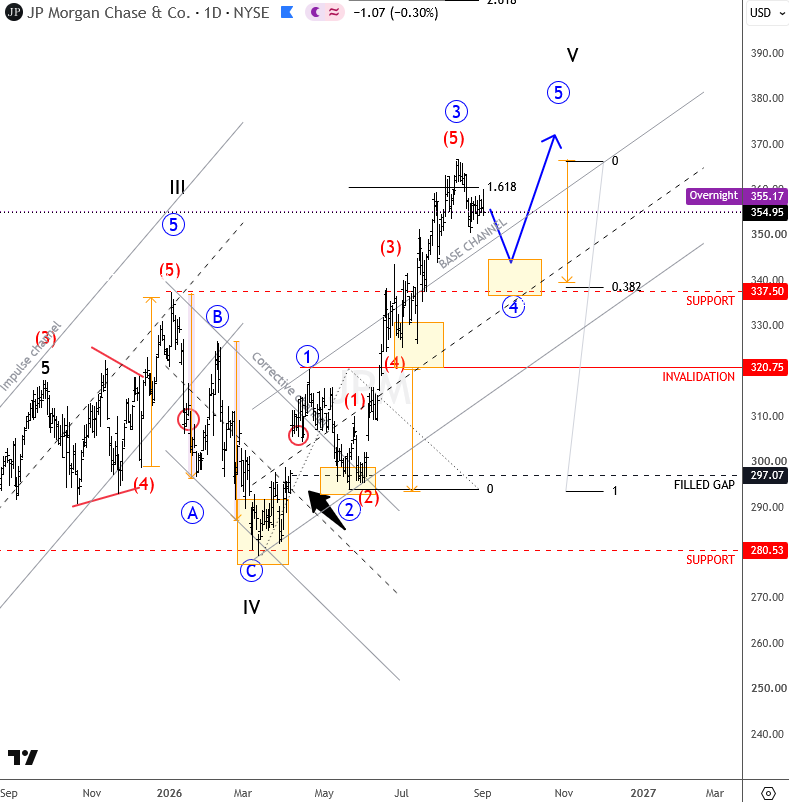
Ideally, the stock is now approaching a wave 4 correction that could revisit the previous swing-high area around 338–345. This zone could become an interesting new support area for a fresh rebound and bullish continuation into wave 5 of black wave V.
The invalidation level can now be moved up to 320. As long as JPMorgan continues to trade above that level, the broader trend remains bullish.
Highlights:
Trend remains bullish while above 320.
The gap support near 300 was respected perfectly.
Wave 3 appears to be in its later stages, so be aware of a potential wave 4 pullback.
Buyers who missed the rally may prefer to wait for a pullback toward 338–345 rather than chase strength at new highs.



Comments
Log in or sign up to join the conversation.