

Image Source: Unsplash
JPMorgan (JPM) enters Q1 with strong capital, rising earnings, and steady loan growth. The bank beat expectations with net income of $14.6B, EPS above $5, and revenue near $46B, showing resilient consumer activity and solid trading performance. Credit costs increased, but capital ratios stayed strong, keeping risk well‑contained.
For this quarter, expect stable revenue, firm profitability, and cautious credit management. Markets may stay volatile, but JPMorgan usually benefits from active trading conditions. Deposits and loans continue to grow modestly, supporting liquidity and earnings. Overall, JPMorgan should deliver steady performance with mild upside despite macro uncertainty.
Elliott Wave Outlook: JPM Weekly Charts August 2025
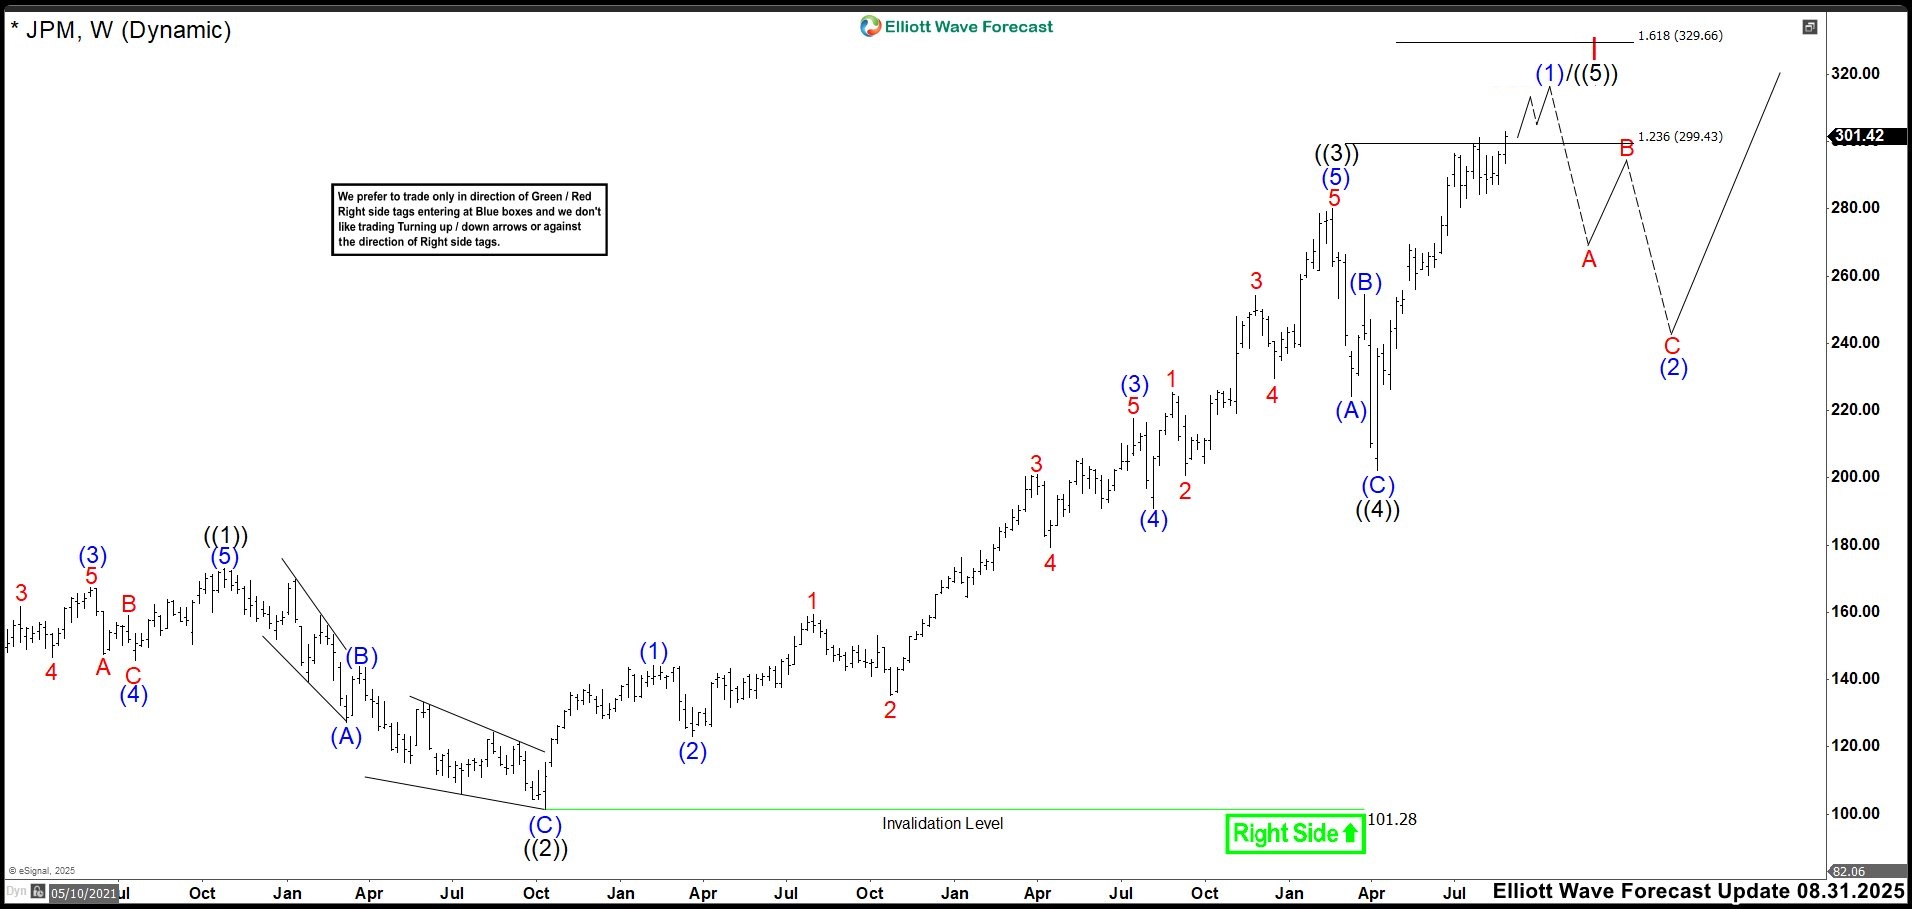
In this latest update, we observed that wave (5) of ((3)) extended to 280.25 high, completing wave ((3)). This was followed by a zigzag correction as wave ((4)), which found its bottom in April. From here, we asw two possible scenarios: First, JPM could build a full impulsive structure to complete wave ((5)), finalizing the entire cycle as wave I. This would imply a deeper correction toward the 160–200 zone as wave II before resuming the bullish trend. The second scenario, which we were currently favoring, suggests the market is forming an extended wave ((5)). In this case, the rally from April would mark wave (1) of ((5)), and once the impulse ends, a corrective wave (2) could bring prices down to the 260–240 area before continuing higher.
If you’re eager to dive deeper into Elliott Wave Theory and learn how its principles apply to market forecasting, you might find these resources helpful: Elliott Wave Education and Elliott Wave Theory.
Elliott Wave Outlook: JPM Weekly Charts January 2026

JPM’s bullish momentum has held through the new year, yet price action remains choppy and uncertain. This behavior suggests the market is entering a consolidation range that could resolve through a correction or a strong bullish breakout. However, each new high shows weaker follow‑through, which strengthens the case for a corrective move and supports the idea of an emerging ending diagonal.
The current range will likely persist because buyers lack the strength to break it decisively. Only a powerful upside impulse could invalidate this expectation; otherwise, JPM may drift sideways for one or two months while completing its wave‑(2) correction. Patience remains essential here, since staying out of the action protects capital until a cleaner opportunity appears.
More By This Author:
Elliott Wave Analysis: Apple Set To Complete Impulsive Rally From Jan 21 LowPepsiCo Bounces From Blue Box Aiming $215 Next
Elliott Wave Analysis: USDCHF Downtrend Set To Extend While Rally Stalls


Comments
Log in or sign up to join the conversation.