

Despite US banking giant JP Morgan (JPM) posting some very solid earnings numbers for the second quarter of 2020, the stock didn't take off.
Indeed, the stock of JP Morgan still trades around 30% below its yearly highs around 140.00 USD despite a revenue record of $33.8 billion in Q2/2020 – a potential bearish sign.
A deeper look into JP Morgan's record revenue in Q2/2020
While JP Morgan's corporate and investment bank posted a record 5.5 billion USD profit for the second quarter, thus making more money in this division than most entire banks typically were able to generate before the coronavirus pandemic, two other divisions of JPMorgan's four main businesses point to "serious trouble ahead".
In fact, JP Morgan's consumer and commercial bank division had to set aside 8.9 billion USD for expected loan defaults across its operations due to the Coronavirus pandemic and the resulting lockdown.
Or to put it differently: the Q2 revenue found its main source because of shrewd moves made under CEO Jamie Dimon to build up its investment bank in the years after the financial crisis.
But it remains to be seen if this success will last, given the fact that sooner, rather than later, US yields are expected to drop further and take the region around 0% into focus. Since volatility and yields are positively correlated to each other, the best environment for trading will probably not last forever.
And not only this: last week showed that US mortgage delinquencies rose to an all-time high, passing the levels seen in 2008 during the Great Financial Crisis (Source: CoreLogic).
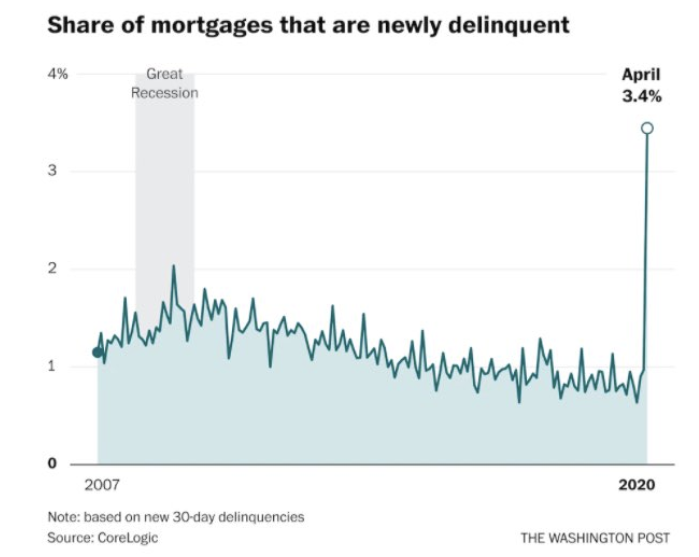
And the chart on the left doesn't include mortgages that are in forbearance, which leads us to the conclusion that non-performing loans should be expected to rise significantly, bringing US banks, but also around the globe, into potential liquidity issues.
That in mind, we have an expectation of a bearish over-performance in bank-related stocks, including the #JPM.
How to trade #JPM in this environment?
First of all: when looking at the daily chart in #JPM, the drop below the SMA(200) clearly signals that the overall advantage in the stock switched to the Short side.
After the surge back above 100 USD in June, the stock dropped again sharply and fell back below 100 USD per share.
All in all, the mode can be considered choppy between the April/May lows around 82.50 USD and the June highs around 113.80 USD.
Still, we currently watch for short-entries between 102.50 and 105.00 USD per share, anticipating a next leg down and test of the region around 82.50 USD, probably even lower around 77.00 USD.
A short-setup would not be given anymore with the stock rising back above 113.80 USD, leaving us with a minimum risk-reward ratio of 1 to 1.75, probably higher:
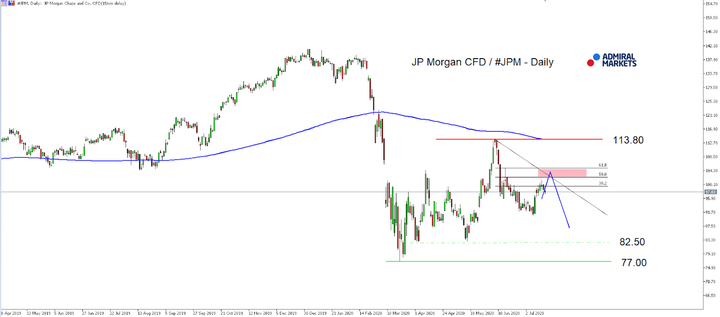
Source: Admiral Markets MT5 with MT5-SE Add-on #JPM chart (between April 18, 2019, to July 20, 2020). Accessed: July 20, 2020, at 10:00pm GMT - Please note: Past performance is not a reliable indicator of future results, or future performance.
In 2015 the value of #JPM increased by 5.51%, in 2016, it increased by 30.68%, in 2017, it increased by 23.93%, in 2018, it fell by 8.72%, in 2019, it increased by 42.8%, meaning that after five years, it was up by 122.9%.



Comments
Log in or sign up to join the conversation.