

As in recent weeks, yesterday's session was focused on the debate around rising inflation in the United States, and once again, the CPI from the US exceeded market expectations, causing a negative close of Wall Street with declines of 0.31%, 0.35% and 0.38% in the Dow Jones, SP500 and Nasdaq respectively.
In addition to inflation from the United States, in today's session, we also learned about the CPI of the United Kingdom and Spain, which have also been higher than expected by the market consensus. The British CPI has settled at 2.5% against the 2.2% expected by the market consensus, while the Spanish CPI has also reached 2.5% against the 2.4% expected.
On the other hand, during yesterday's session, we also learned the quarterly results of two market giants such as JP Morgan Chase & Co and Goldman Sachs, which like the quarterly results published last April, beat expectations with very positive results for the second quarter of the year.
JP Morgan is the largest bank in the United States and yesterday it presented very positive quarterly results in which it obtained a profit per share of $3.78 and a revenue of $31.4 billion against the $3.16 per share and the income of $30 billion expected by the market consensus.
Despite these good results, the share price was dragged down by the uncertainty generated by inflation in the United States, causing it to close with a decline of 1.49%.
Technically speaking, if we look at the daily chart we can see that, although the long-term trend is clearly bullish, since the middle of last February the price is moving in an important sideways range with support around the level of $147 (red band).
It is important that in the coming sessions we pay close attention to the price action since the company could be forming a shoulder-head-shoulder formation that, if confirmed, could cause a change from uptrend to bearish. Furthermore, this change in trend could be confirmed with the possible breakout of the support level represented by the red band, although the price would subsequently have to face its main support level in an average of 200 sessions.
On the contrary, if the price manages to maintain these support levels, the sentiment would continue to be bullish thanks to the good results, although, for this, we will have to be very attentive to the evolution of inflation and how it affects the financial markets.
(Click on image to enlarge)
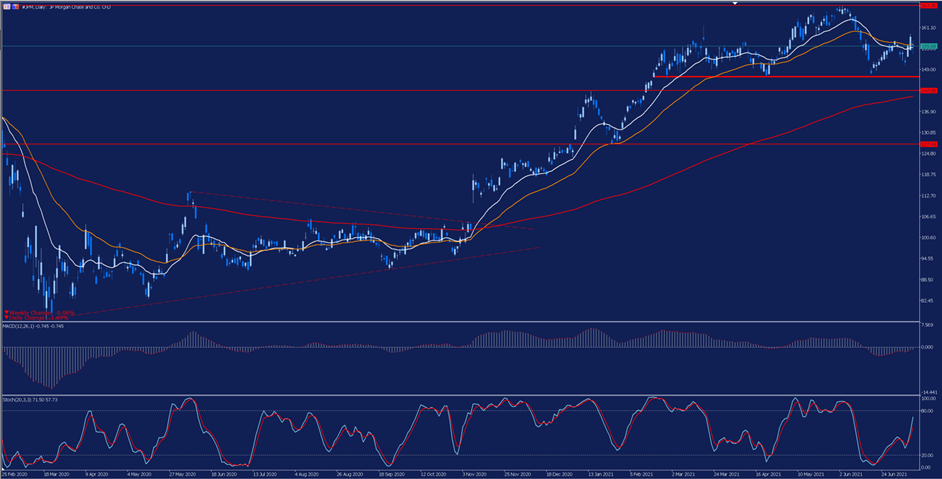
Source: Admiral Markets MetaTrader 5. JP Morgan's daily chart. Data range: February 24, 2020 to July 14, 2021. Prepared on July 14, 2021 at 11:40 a.m. CEST. Please note that past returns do not guarantee future returns.
Evolution in the last 5 years:
- 2020: -8.85%
- 2019: 42.80%
- 2018: -8.72%
- 2017: 23.93%
- 2016: 30.68%
Meanwhile, Goldman Sachs also presented positive quarterly results also exceeding market expectations by reaching earnings per share of $15.02 with strong revenues of $15.39 billion versus $9.96 million and $12.04 billion expected.
As in the case of JP Morgan, this company closed in the negative despite the good results, giving up 1.19% to $375.98 per share, due to inflation.
Technically speaking, after marking all-time highs on June 4 around $391 per share, the price is experiencing a pullback that has led it to bounce off its support/resistance level represented by the red band.
As with the previous action, we will have to be very attentive to the evolution of the price action and inflation in the United States, since if the instability in the markets continues and the price loses its current support level we could see a change from uptrend to bearish, although for this the price would have to face several support levels and its average of 200 sessions.
Despite this, for the moment the feeling remains positive and these good results could lead the price to seek its maximums.
(Click on image to enlarge)
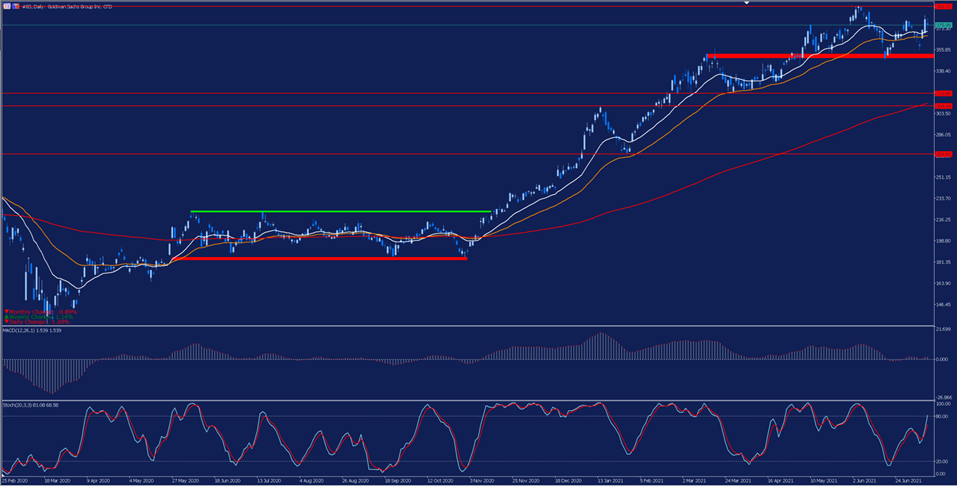
Source: Admiral Markets MetaTrader 5. Goldman Sachs daily chart. Data range: February 25, 2020 to July 14, 2021. Prepared on July 14, 2021 at 11:45 a.m. CEST. Please note that past returns do not guarantee future returns.
Evolution in the last 5 years:
- 2020: 14.69%
- 2019: 37.64%
- 2018: -34.43%
- 2017: 6.39%
- 2016: 32.86%



Comments
Log in or sign up to join the conversation.