
Joshua M Brown shares a chart comparing Shiller P/E ranges and future 5-year returns.
The Shiller P/E ratio is also known as the Cyclically Adjusted Price-Earnings (CAPE) ratio and the P/E 10 ratio. It was developed by Dr. Robert Shiller, who won the Nobel Prize for his work in economics in 2013. CAPE is a tool people use to find the likely returns of the stock market based on current valuations of stocks. (For more, go to Investopedia.)
Josh analyses the CAPE ratio--its usefulness and its flaws. It's flaws are many. One is that the ratio does not take into account the economic environment that the stock market is operating in. For instance, interest rates likely have a significant effect on the ratio of valuations to returns: a CAPE ratio of 20 when interest rates are high would not equal a CAPE ratio of 20 when interest rates are near zero. It would be interesting to add this variable to a statistical analysis of Shiller's investing tool.
CAPE, Forward Returns and You
By Joshua M Brown, The Reformed Broker
Chart below from Credit Suisse via CNNMoney:
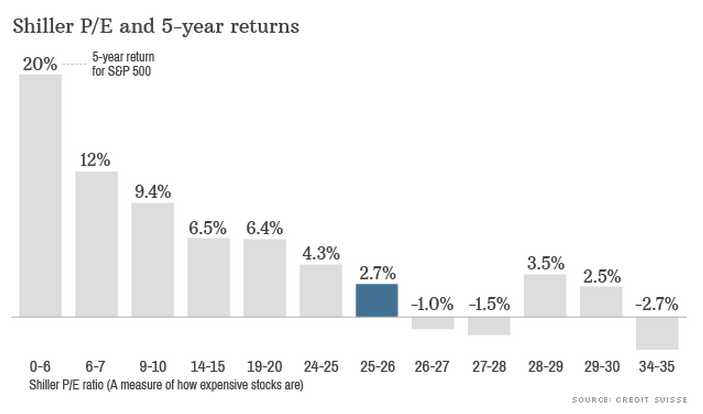
The S&P 500 currently sells at a cyclically adjusted PE (a smoothed out multiple of ten years’ worth of earnings) of 25 right now. History suggests that the next five years are likely produce subpar returns for US stocks, on a go-forward basis, of just 2.7% annualized between now and 2019. Over the last 130 years, according to the Credit Suisse analysis, stocks sold for an average CAPE ratio of 16 – so by this measure we are fairly expensive.
Here’s the problem with buying into this CAPE argument hook, line and sinker…
First of all, interest rates have almost never been this low for this long – people need a return on their capital, as do insurance companies, pensions, sovereign wealth funds and corporations. It makes perfect sense for us to be selling at an elevated CAPE and there’s no reason this couldn’t continue.
Second of all, CAPE ratios have been elevated above that 16X average for most of the last 25 years. So if you were waiting to buy in at a level below it, you’ve been on the sidelines for the greatest value-creating era of all time. CAPE may have some predictive value but not always and it is certainly not omniscient.
Third, of course we know that the numbers above are average rates of return – by definition averages are produced by much more wide-ranging highs and lows.
Fourth, we also know that the modern investors’ opportunity set is far from limited to just large cap US equities. It’s never been cheaper and simpler to diversify beyond the S&P 500 – where CAPE ratios leave stocks at much less expensive valuations. So even if we’re to see subpar returns for the US, that’s only 50% of the world’s total equity market capitalization.
(My emphasis in bold.)
Keep reading: CAPE, Forward Returns and You


Comments
Log in or sign up to join the conversation.