
The Federal Reserve data release (Z.1 Flow of Funds) - which provides insight into the finances of the average household - shows improvement in average household net worth. Our modeled "Joe Sixpack" - who owns a house and has a job, and essentially no other asset - is better off than he was last quarter (but his growth rate of improvement continues to decline).

Analyst Opinion of the Joe Sixpack and Middle Man Indices - Z.1 Flow of Funds
One should worry about the 35% of Americans who do not own any financial asset. Z.1 Flow of Funds net worth data is not inflation adjusted. and
Food for thought [from the data in the Z-1 Flow of Funds]:
- It is interesting that consumer credit year-over-year growth was 5.9 % according to Fed data.
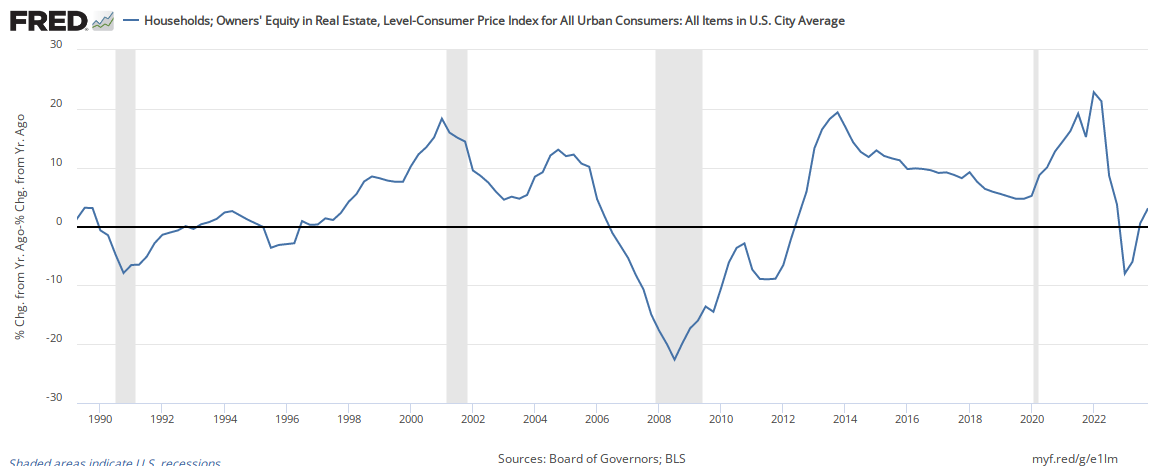
- The average house has appreciated around 6% but the REAL owners equity in their house is up 7.7 % (where the growth rate of their equity has been trending down for the last three years.
(Click on image to enlarge)
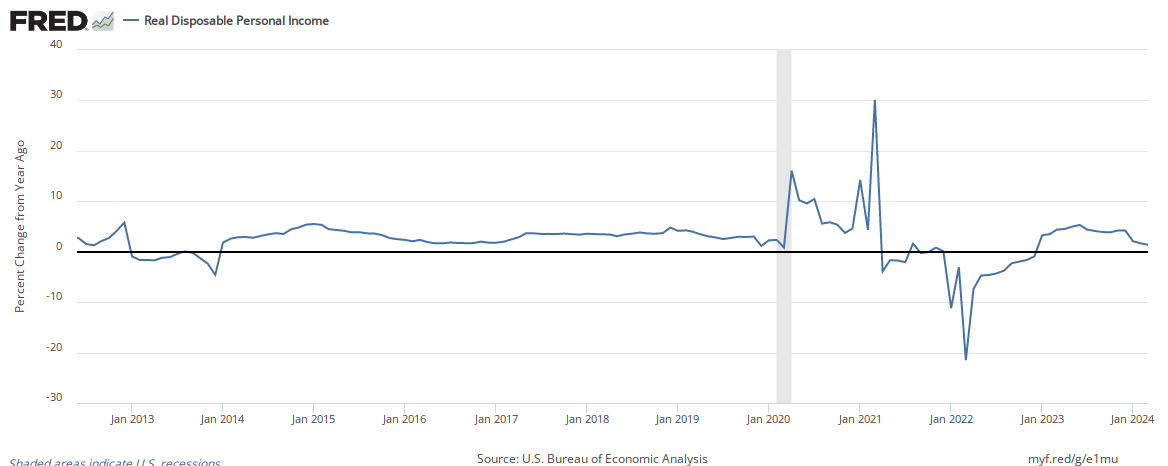
- Real disposable Personal Income year-over-year rate of growth is 1.9 % - and has been in a general down trend since the end of 2014.
(Click on image to enlarge)
- The rate of growth of financial assets is 5.9 % - and has been in a general downtrend since the beginning of 2014.
(Click on image to enlarge)

- The year-over-year growth rate of the Z.1 Flow of Funds net worth data was 6.3% [last quarter's year-over-year growth was a revised 6.4%].
(Click on image to enlarge)
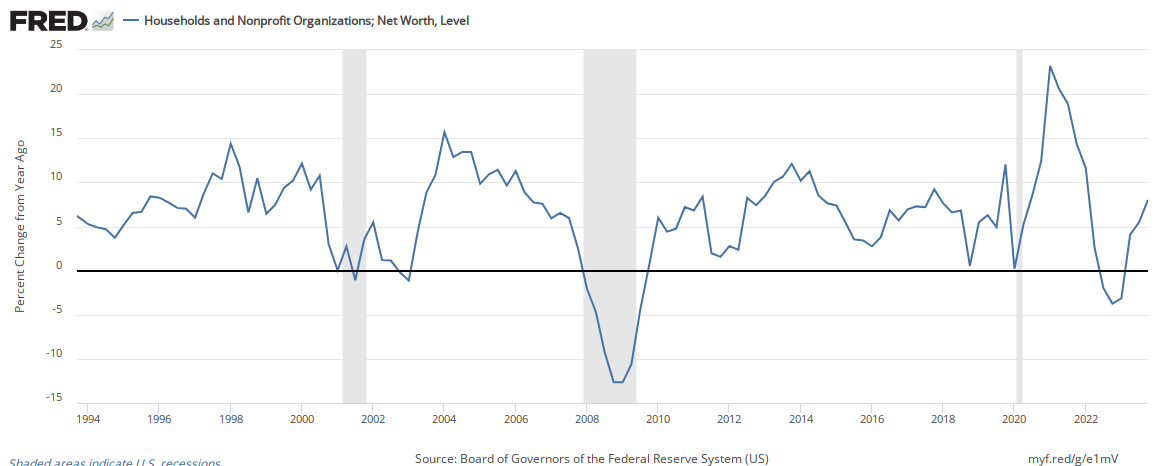
- But now inflation is starting to be a factor in net worth - as the Consumer Price Index is up 2.3% year-over-year.
You may ask why this analysis is important? It looks at the financial health of the consumer - and in a consumption based economy, it measures the dynamics affecting the consumer.
35% of Americans who own no home or have any other assets are no better off (living from paycheck to paycheck) - and consumption is based simply on income. The median household's income is no better then it was 16 years ago - according to Sentier Research's Household Income Index [click here to read analysis of the current situation]. Here is the graph from their analysis which shows that REAL household income has changed very little in the last two years.
(Click on image to enlarge)

First, from the Z.1 Flow of Funds report, what was shown about Household Net Worth and Growth of Domestic Nonfinancial Debt. Cumulative Household net worth grew, while cumulative household debt growth also grew.
(Click on image to enlarge)

(Click on image to enlarge)

The Joe Sixpack Index
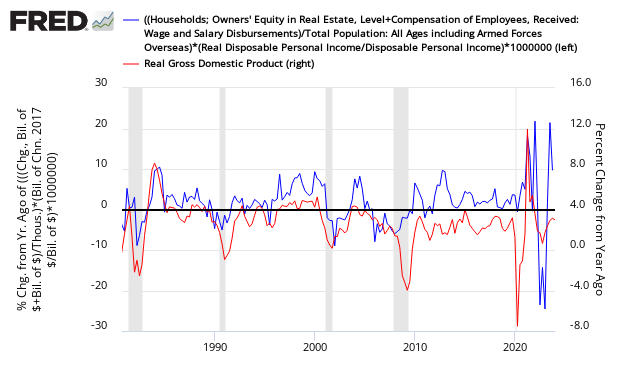
The Joe Sixpack Index is a composite index of home prices and wage income (again - Joe owns a house with a mortgage, has a job, and no other assets). This index was designed to measure how rich Joe should feel. The theory is that the richer Joe feels, the more Joe will spend.
- The data in this index is only updated every three months, and the data was updated with the release of the Federal Reserves Z.1 Flow of Funds.
- It is inflation and population adjusted.
- Currently, Joe has a house that is increasing in value - and his income in inflation terms is growing - so the net affect is that the index improved - and now indicates Joe feels richer than he did in the last quarter. However. the rate of increase is continuing to slow.
Joe Sixpack Index (blue line, left axis) shown against GDP (red line, right axis)
(Click on image to enlarge)
The Middle Man Index
The middle class household with financial assets and real estate assets is Middle Man. A Federal Reserve Publication shows the percentage of households owning various financial assets. Other than real estate, Middle Man holds transaction accounts (checking - 1% of all financial assets) and retirement accounts (roughly estimated by Econintersect at 25% of household financial assets).
(Click on image to enlarge)

Unfortunately, retirement accounts are not separately detailed in the Z.1 reporting - but the graph below uses 25% of the change in Total Household Assets as a proxy for change in retirement accounts.
Total Household Assets (blue bars) vs Savings (red bars)
(Click on image to enlarge)

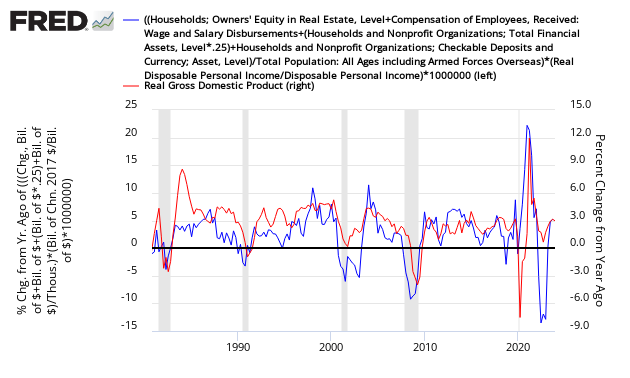
Adding the financial assets of Middle Man to the housing and compensation data used in the Joe Sixpack index, we see that Middle Man is better off than last quarter with his situation - but the rate of improvement declined. It is the growth in value of real estate and other assets that is the governing factor for Middle Man (not wages).
Middle Man Index (blue line, left axis)
(Click on image to enlarge)
Takeaway
My takeaway is:
- On whole, American households with no assets and only income from wages or safety nets has little change in their lot in life.
- This is a lagging view of the average American's situation. Having said this, Joe and Middle Man's consumption is somewhat affected by how rich they feel - and it takes some time for the wealth effect to sink in.
- The majority of Americans are more like Joe Sixpack than Middle Man.
Caveats on this Post:
Most of the data in this post comes from "Flow of Funds Accounts of the United States" (Z.1) data release from the Federal Reserve which is released quarterly. Although Econintersect can validate the data in general using other sources, micro movements are difficult to validate. Importantly, the Z.1 data is a treasure chest of aggregated data across all sectors of the economy - and an invaluable tool in evaluating historical relationships.


Comments
Log in or sign up to join the conversation.