


USD/JPY is trading around 153.70 on Friday, down for the day after briefly spiking above 154.50 following the US inflation release. The pair erased that move within hours as Yen strength overwhelmed the Dollar's knee-jerk bounce, leaving it back toward the lower end of its recent range following this week's sharp slide from the mid-155s.
United States (US) Consumer Price Index (CPI) data held at 3.4% year on year in August, matching both July's reading and market expectations, according to the Bureau of Labor Statistics (BLS). On a monthly basis, prices rose 0.4%, a marked pick-up from the 0.1% gain the month before. The core measure, which strips out food and energy, rose 0.3% on the month, above the 0.2% forecast, although the annual core rate eased to 2.4% from 2.5%.
The US Dollar (USD) climbed at first, helped by the firmer monthly core figure, but the move lost momentum quickly against the Japanese Yen (JPY), which has been among the strongest currencies this week. The initial rebound lacked the fuel to hold.
Markets see the central bank raising interest rates next week, with a 25-basis-point (bps) hike to 1.25% on the table, a move that would lift Japanese borrowing costs to their highest level in more than three decades.
That combination of a BoJ edging tighter just as the Dollar's inflation-day support drains away is tilting the balance toward the Yen and keeping USD/JPY under pressure around the low-153s. Strength is visible across the board, with the Yen crosses also easing today.
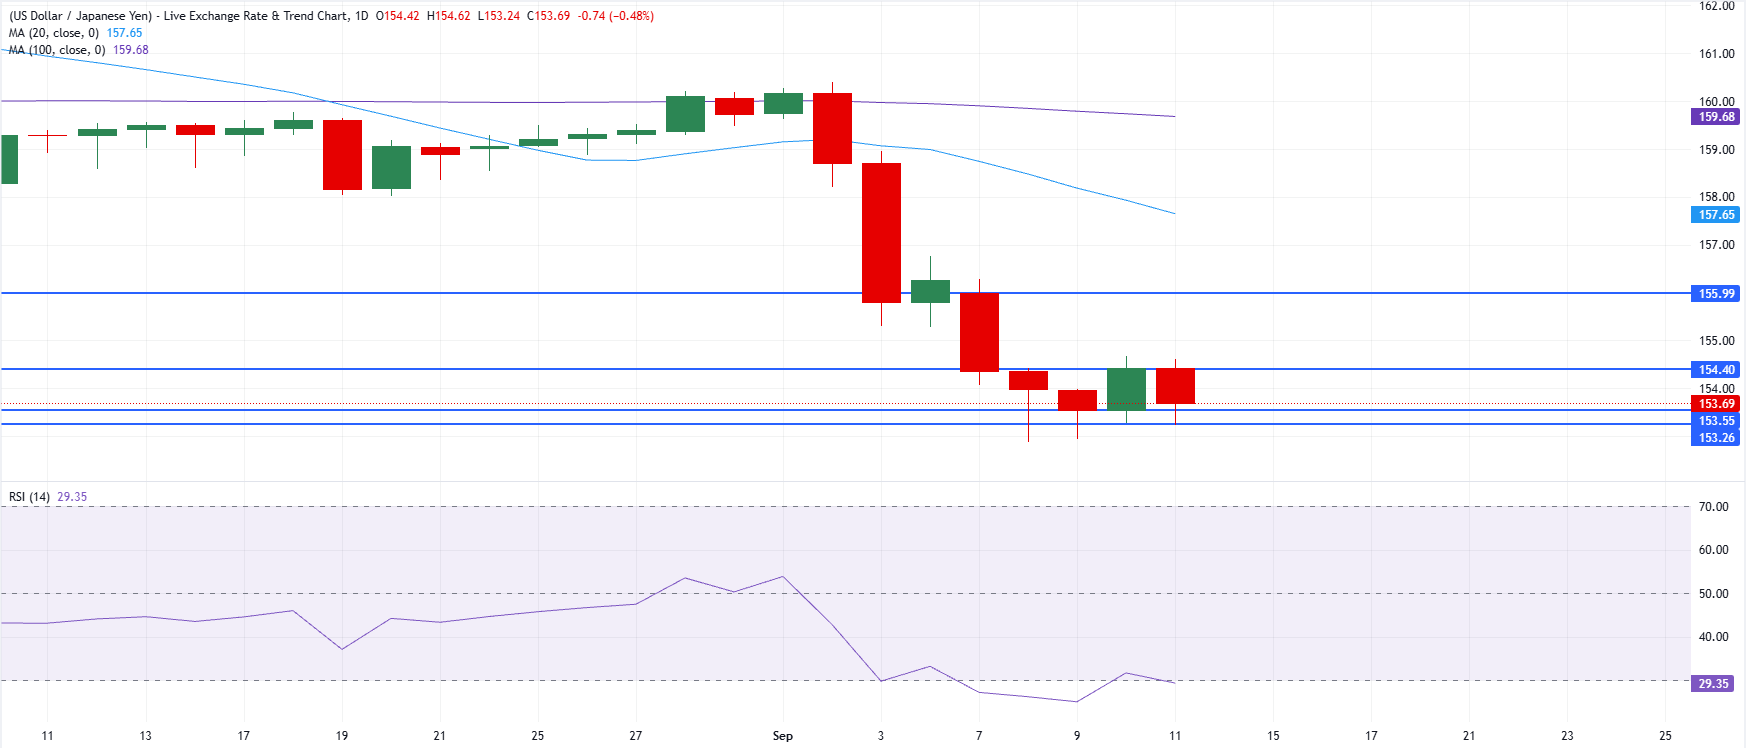
Short-term technical analysis:
In the daily chart, USD/JPY trades at 153.69, extending a corrective bearish phase with price lodged well below the 20-day Simple Moving Average (SMA) at 157.65 and the 100-day SMA at 159.68, which now frame a broad cap on any recovery attempts. The Relative Strength Index (RSI) at 29.35 sits just inside oversold territory, hinting that downside momentum is stretched but not yet reversed, so bounces are likely to be treated as corrective while the pair remains under these key moving-average barriers.
On the topside, initial resistance is aligned at 154.40, ahead of a more notable hurdle at 155.99; a daily close above these levels would be needed to ease immediate selling pressure before the focus could shift toward the 20-day SMA at 157.65 and the 100-day SMA at 159.68. On the downside, nearby support is seen at 153.55, followed by a lower floor at 153.26, where failure to hold would open the way to an extension of the downtrend despite the already oversold RSI backdrop.



Comments
Log in or sign up to join the conversation.