

Today's release of the January Producer Price Index (PPI) for Final Demand was up 0.5% month-over-month seasonally adjusted, up from a 0.2% increase last month. It is at 2.1% year-over-year, up from 1.3% last month, on a non-seasonally adjusted basis. Core Final Demand (less food and energy) came in at 0.5% MoM, up from 0.1% the previous month and is up 1.7% YoY NSA. Investing.com MoM consensus forecasts were for 0.1% headline and 0.1% core.
Here is the summary of the news release on Final Demand:
The Producer Price Index for final demand advanced 0.5 percent in January, seasonally adjusted, the U.S. Bureau of Labor Statistics reported today. Final demand prices rose 0.2 percent in December and declined 0.1 percent in November. (See table A.) On an unadjusted basis, the final demand index increased 2.1 percent for the 12 months ended in January, the largest advance since moving up 2.1 percent for the 12 months ended May 2019.
In January, 90 percent of the increase in the final demand index is attributable to prices for final demand services, which climbed 0.7 percent. The index for final demand goods inched up 0.1 percent.
Prices for final demand less foods, energy, and trade services advanced 0.4 percent in January, the largest increase since a 0.4-percent rise in April 2019. For the 12 months ended in January, the index for final demand less foods, energy, and trade services moved up 1.5 percent. More…
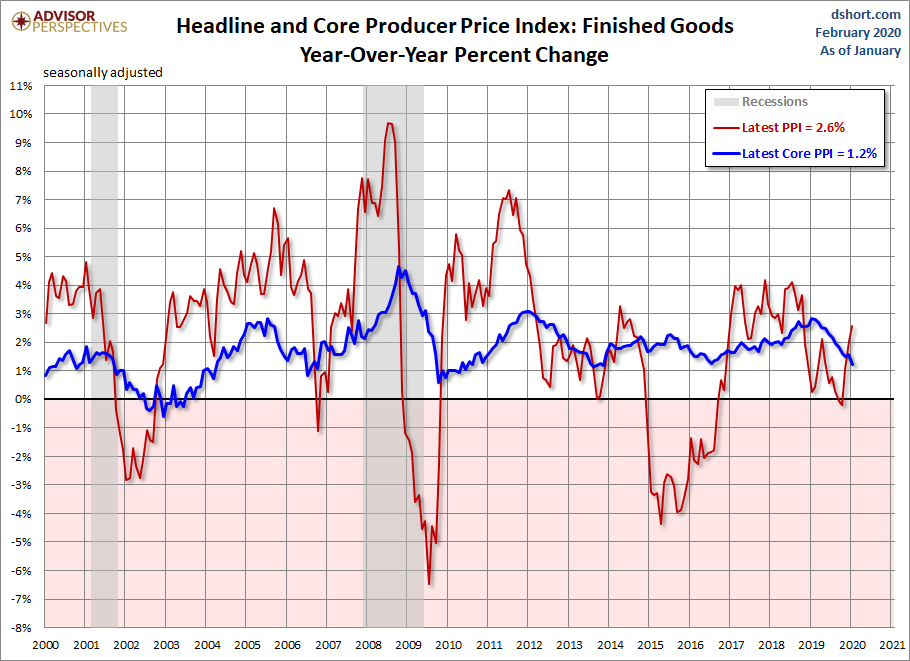
Finished Goods: Headline and Core
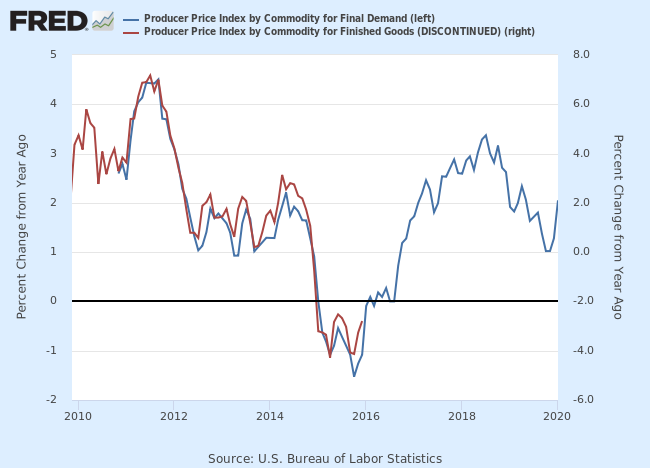
The BLS shifted its focus to its new "Final Demand" series in 2014, a shift we support. However, the data for these series are only constructed back to November 2009 for Headline and April 2010 for Core. Since our focus is on longer-term trends, we continue to track the legacy Producer Price Index for Finished Goods, which the BLS also includes in their monthly updates.
As this (older) overlay illustrates, the Final Demand and Finished Goods indexes are highly correlated.
FRED® Graphs ©Federal Reserve Bank of St. Louis. All rights reserved.
(Click on image to enlarge)
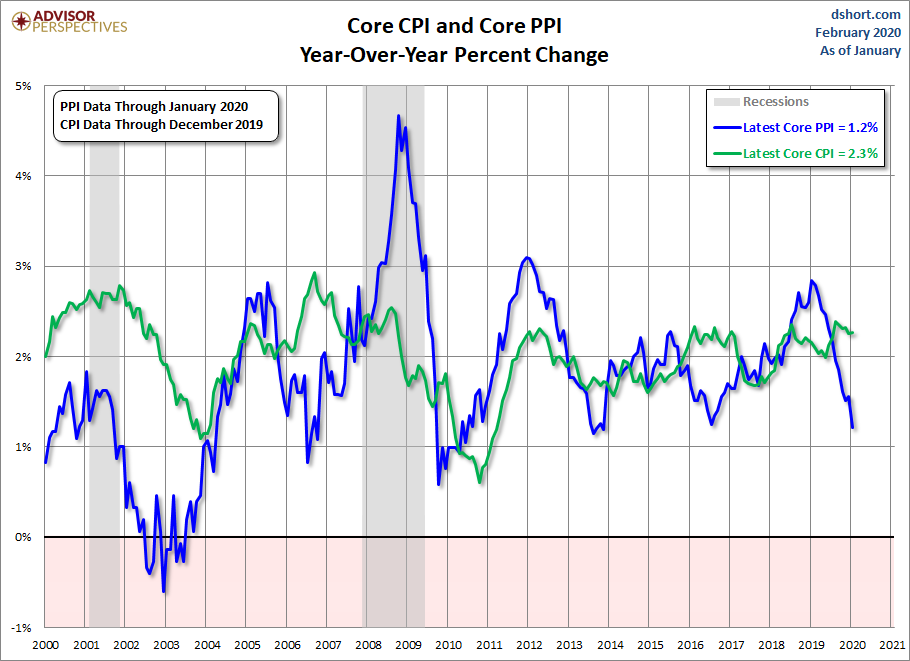
As the next chart shows, the Core Producer Price Index is far more volatile than the Core Consumer Price Index. For example, during the last recession producers were unable to pass cost increases to the consumer.
(Click on image to enlarge)



Comments
Log in or sign up to join the conversation.