

In this technical blog, we are going to take a look at the past performance of 1 hour Elliott Wave Charts of IYR, which we presented to members at elliottwave-forecast. In which, the rally from 16 December 2019 low ($89.40) showed an impulse structure. Thus suggested that it’s a continuation pattern. And as per Elliott wave theory after a 3 waves pullback, it should do another extension higher in 5 waves impulse structure at least. Therefore, we advised members not to sell the instrument & trade the no enemy areas ( blue boxes) as per Elliott wave hedging remained the preferred path looking for 3 wave reaction higher at least. We will explain the structure & forecast below:
IYR 1 Hour Elliott Wave Chart From 1/2/2020
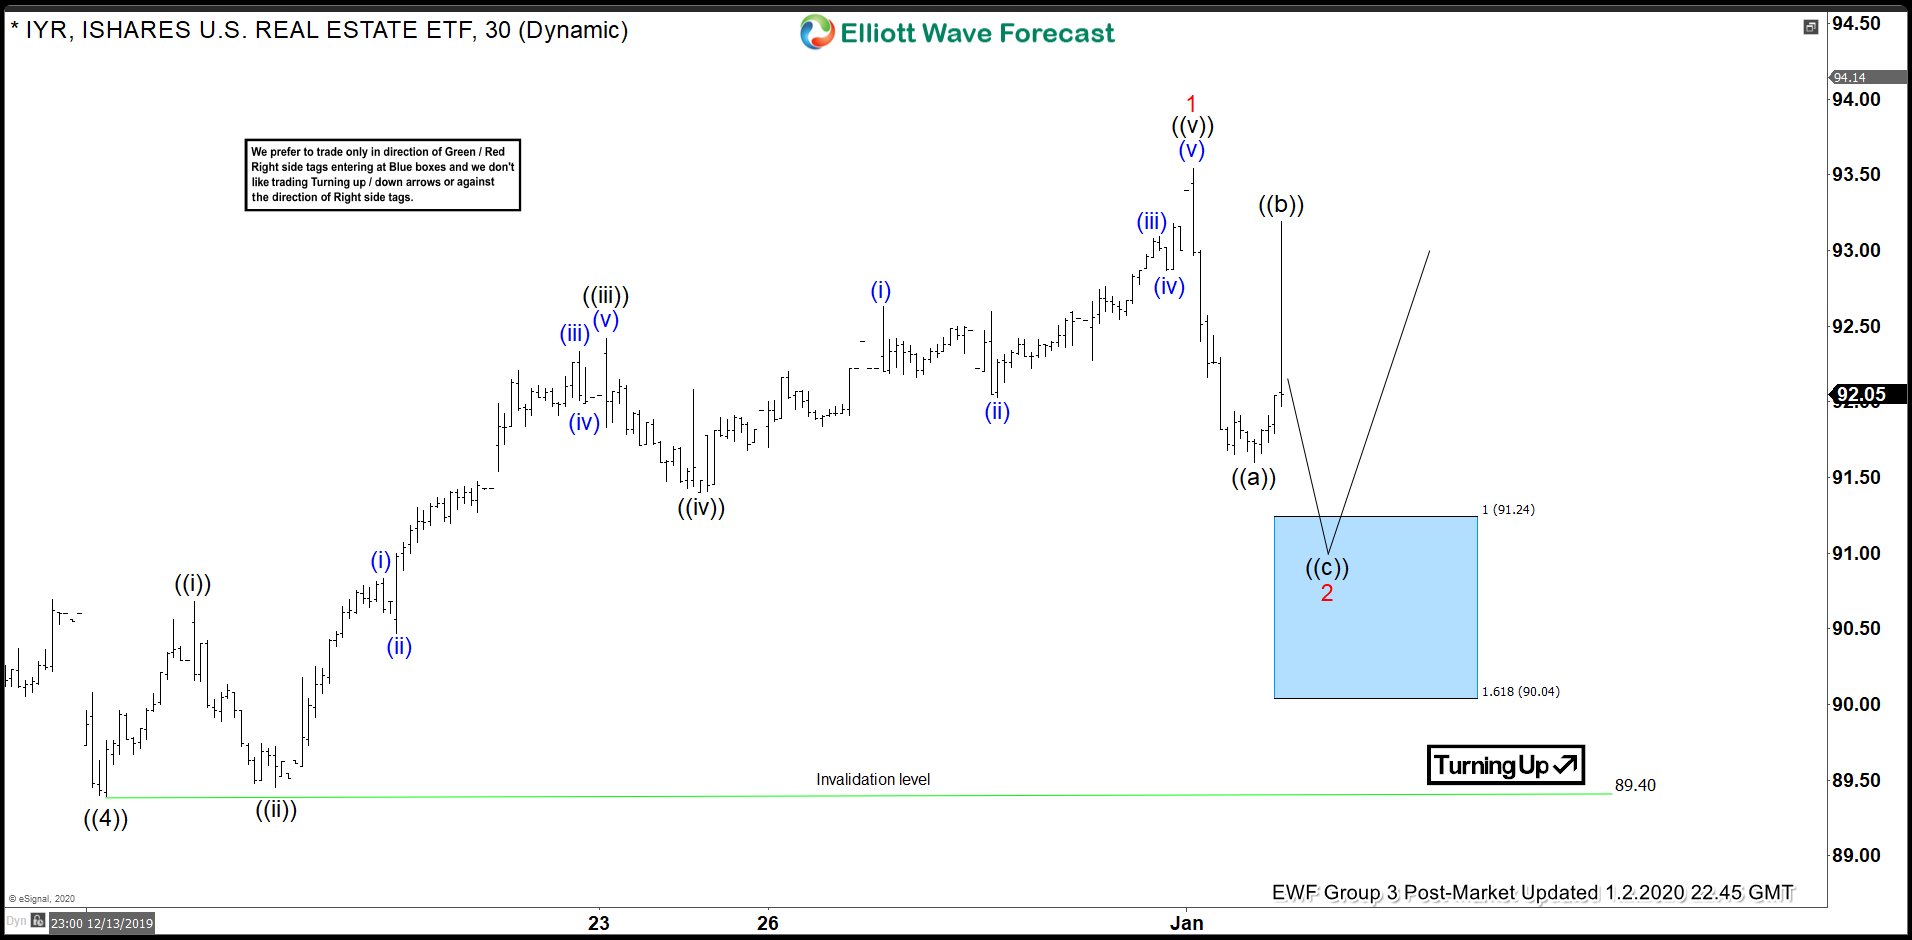
IYR 1 Hour Elliott Wave Chart from 1/2/2020 Post-Market update. In which the ETF ended the 5 wave impulse rally in wave 1 at $93.54 high. Down from there, the ETF made a wave 2 pullback. The internals of that pullback was expected to unfold as a zigzag structure. While wave ((a)) ended at $91.60 low. Wave ((b)) ended at $93.19 high. Wave ((c)) was expected to see a move lower towards $91.24-$90.04 100%-161.8% Fibonacci extension area of ((a))-((b)). From where the buyers were expected to appear in the ETF looking for another 5 waves rally. Or to do a 3 wave reaction higher at least.
IYR 1 Hour Elliott Wave Chart From 1/12/2020
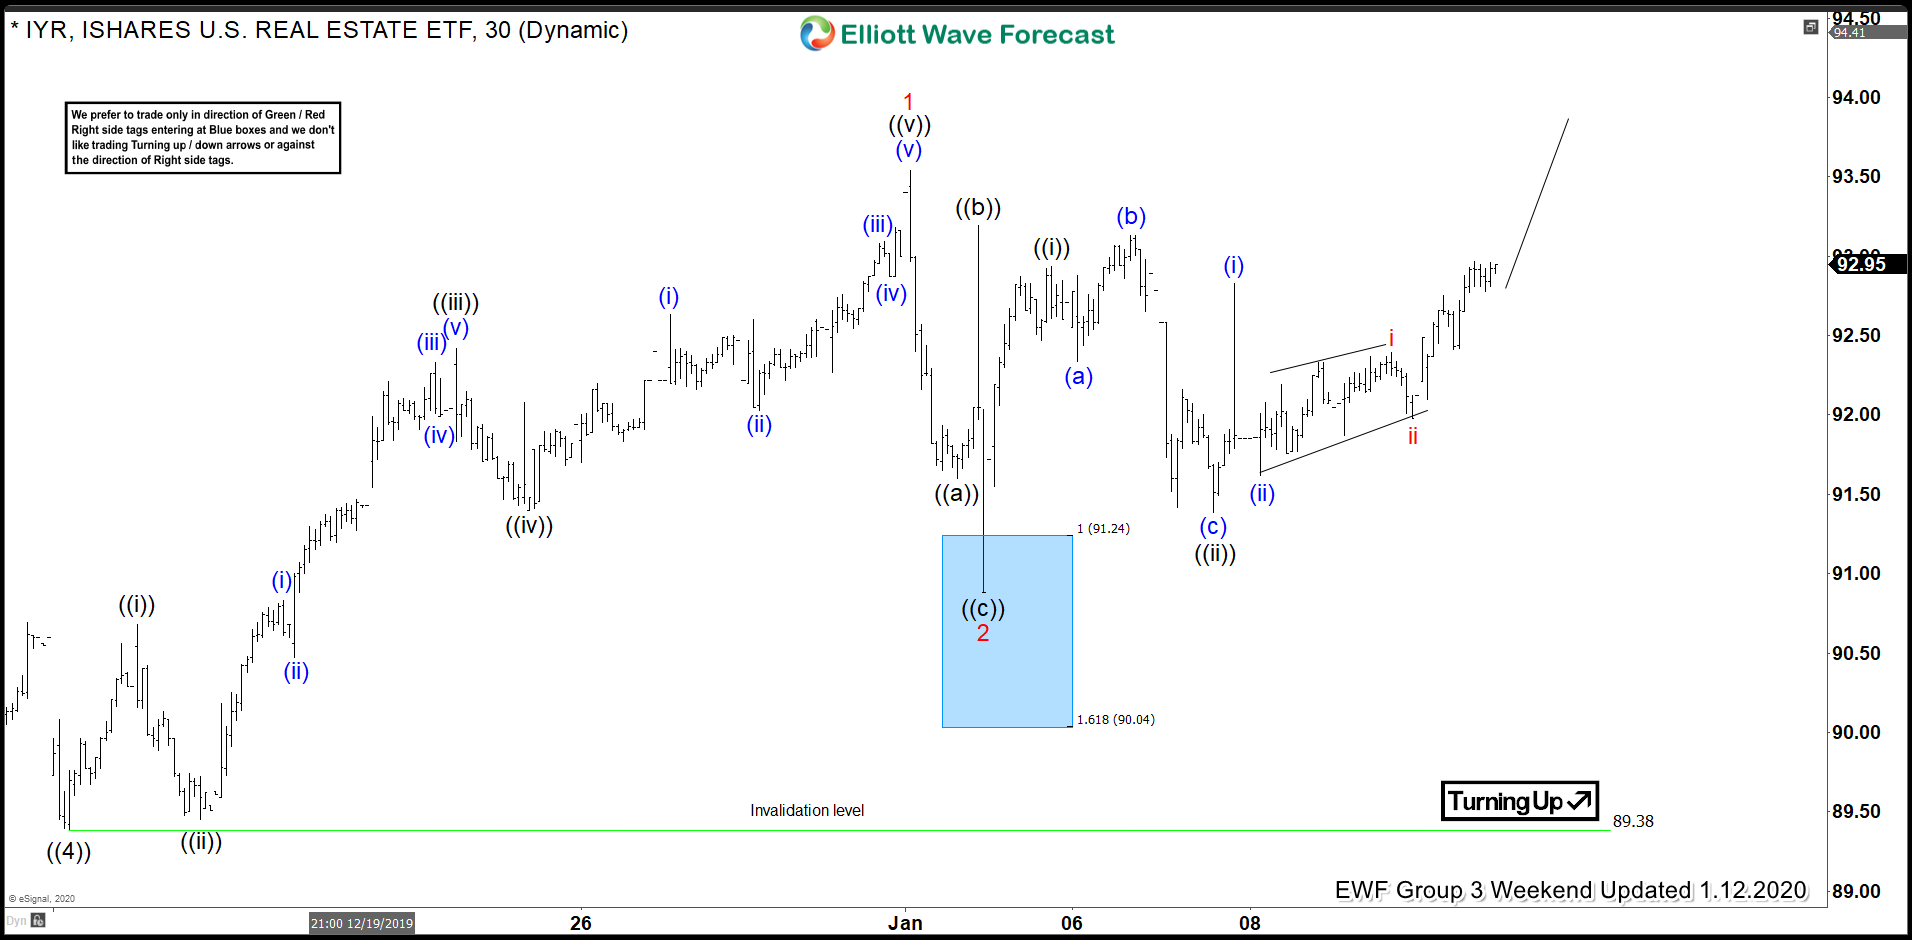
IYR 1 Hour Chart from 1/12/2020 Weekend update. In which the ETF managed to reach the blue box area at $91.24-$90.04. And showing reaction higher taking place from the blue box area. Thus allowed our members to create a risk-free position shortly after taking the long position from the blue box area. But a break higher above prior wave 1 higher ($93.54) was still needed to confirm the next extension higher.
IYR 1 Hour Elliott Wave Chart From 1/19/2020
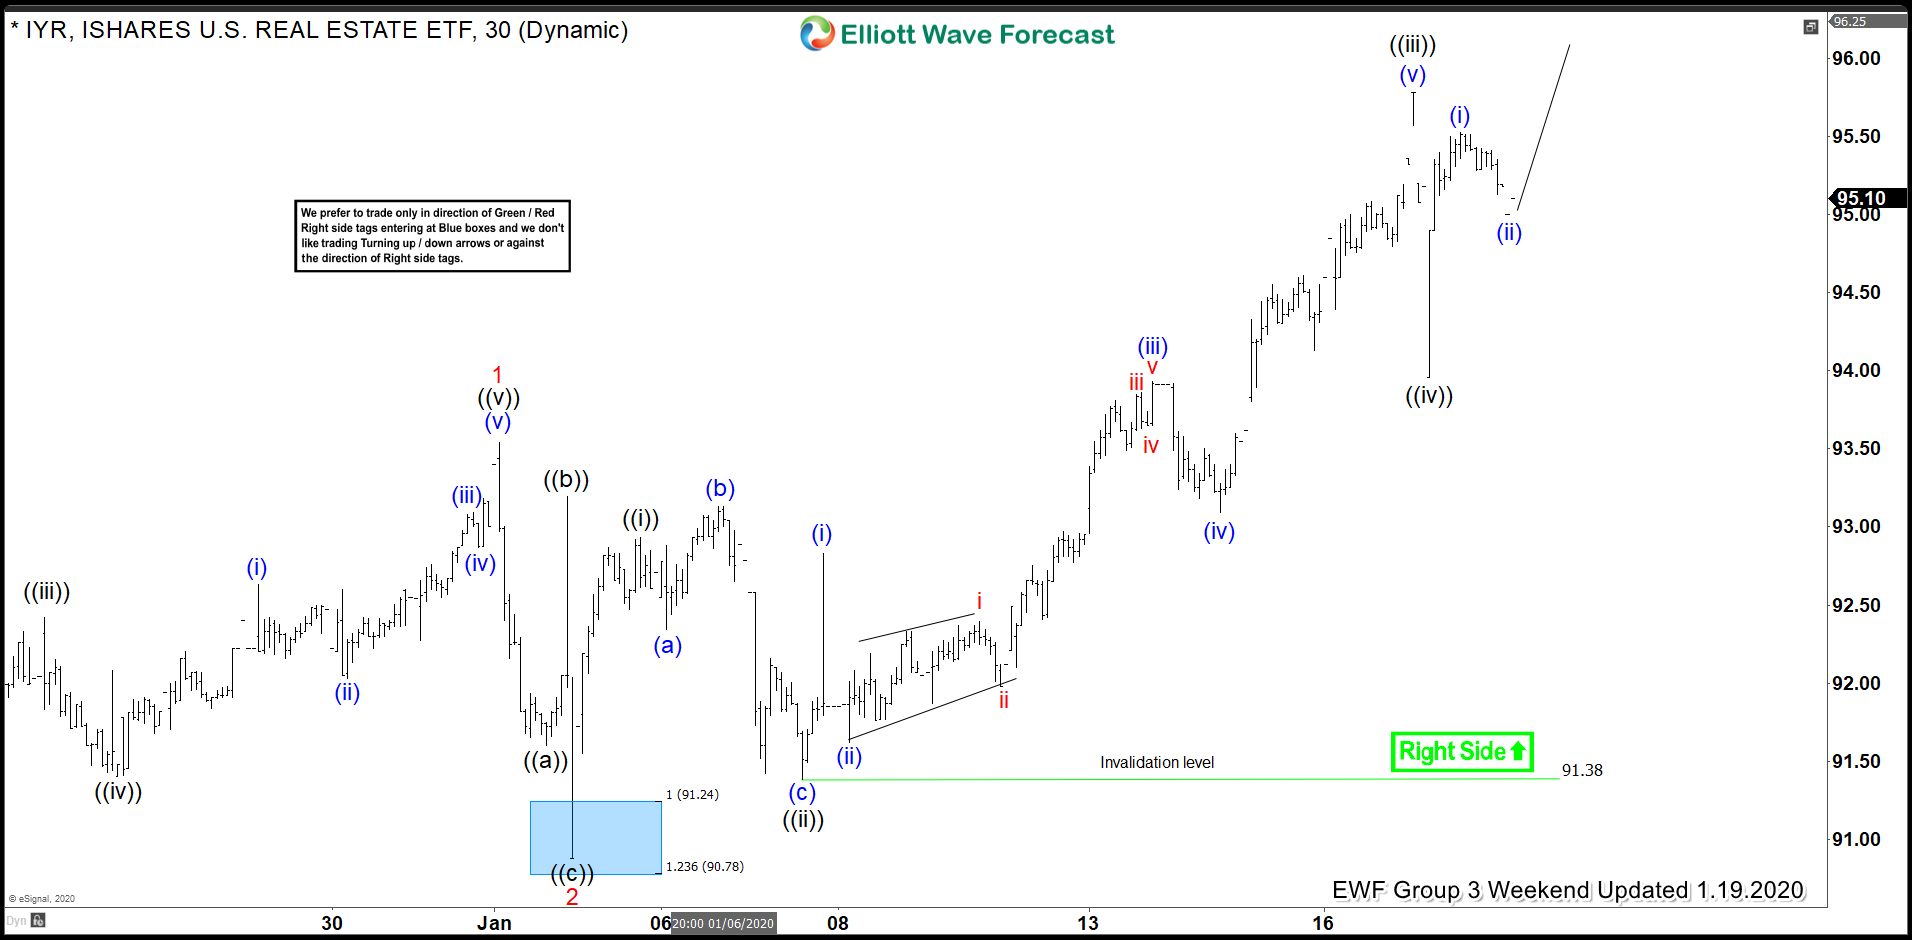
Here's 1 Hour Elliott Wave Chart from 1/19/2020 Weekend update. In which the ETF manages to make a new high above $93.54 high and confirmed the next extension higher. It's important to note that the rally from the blue box area also came out in 5 wave impulse structure as we initially suspected. Since then, the ETF has managed to reach the 100% extension area of 1-2 at $95.54 level therefore, thus it reached the targets for longs.



Comments
Log in or sign up to join the conversation.