


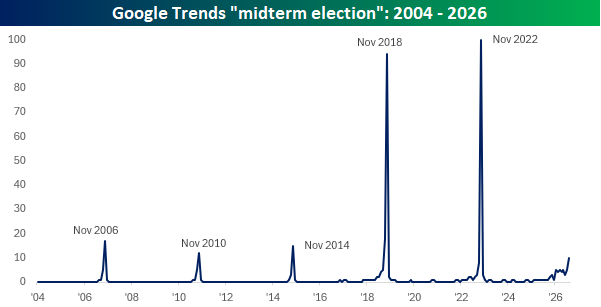
September kicks off tomorrow, and the midterm chatter really hasn’t started yet. Just wait until after Labor Day. The chart below shows a history of Google searches for “midterm election” using Google Trends. As shown in the chart, searches start to spike right around now every four years and peak in November (as you would expect). Based on Google searches, discussion of midterm elections was especially extreme in the last two cycles, and if you think that was bad, the current cycle could even exceed those extremes. That’s because for the month of August, searches for “midterm election” have been at least 2.5 times greater than any other August since 2004.
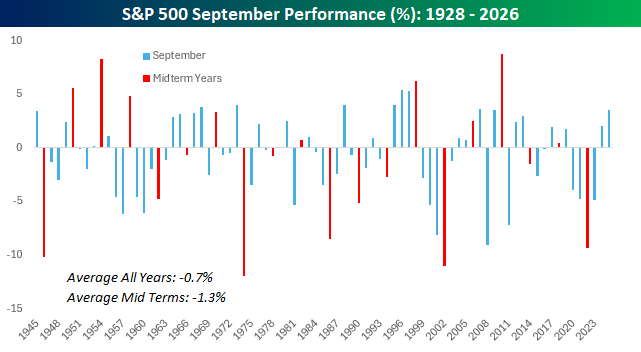
September has also traditionally been the weakest month of the year for stocks, and even though the last two were positive, they broke a streak of four straight down Septembers. All in, the S&P 500’s average September performance since 1945 has been a decline of 0.7%. Even worse, Septembers in midterm years have tended to be even weaker, with the S&P 500 averaging a decline of 1.3%, or nearly twice the decline of all years. There’s also been some major volatility in midterm Septembers. As shown in the red bars below, the four best and four worst Septembers since WWII were all in midterm years, including 2022, which was the fourth worst September for the S&P 500.
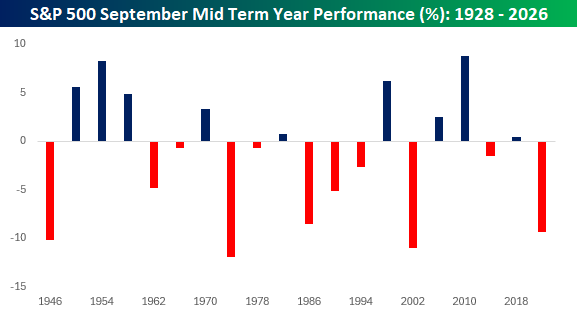
Just looking at September performance during midterms shows the big moves. Of the 20 midterm election years since WWII, the S&P 500 has been just as likely to rally or fall at least 5% as it is to move less than 5%. For comparison, for all other Septembers since 1945, the S&P 500 has only had a 5% move 15% of the time. While the market may not rise every September, volatility usually does.


Comments
Log in or sign up to join the conversation.