
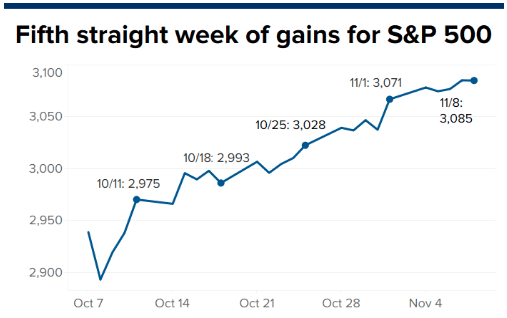
The S&P 500 (SPX) has run fast, furious and unabated in its journey toward the 3,100 level. The benchmark index narrowly missed achieving this goal on Thursday of this past trading week. Nevertheless, the S&P 500, alongside its peer indices all finished higher for the week once again. The S&P 500 was up 0.85% from last Friday and is up 23.38% year-to-date. While the S&P 500 rose for a fifth straight week, the Nasdaq (NDX) rose 1.1% this past week, extending its weekly winning streak to six. The Dow Jones Industrial Average (DJIA) posted a three-week winning streak, advancing 1.2 percent.
All Things S&P 500
It was another strong week for the S&P 500, even as it lagged it's peer group performance gains for the week. Nonetheless, we continue to see improvements in the 2 key market structures that serve as the pillars of the market presently. Those 2 pillars are market structure, defined by breadth/internals and market sentiment, defined by key investor surveys and/or market indicators.
As we've detailed for the last several weeks, the S&P 500 has built a goodly amount of white space between itself and the index's 50-DMA.
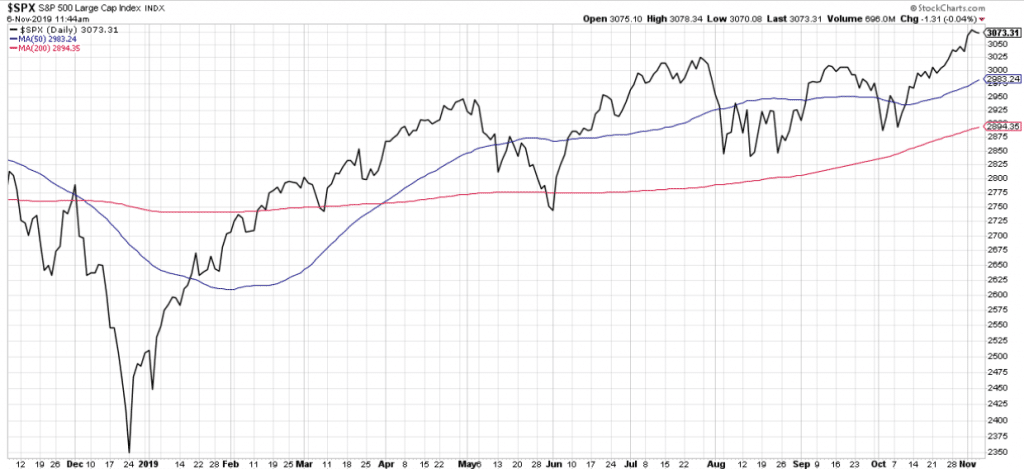
The 50-DMA (blue line) resides at 2,983, exactly 110 points below the closing price as of Friday. That's a lot of white space folks, or roughly 3.4% lower to the 50-DMA. Investors should keep in mind that a gap in levels has been created in the past trading week, which can be found at 3,066. If something should serve to disrupt our 2 market structures, they will be tested once again and the gap may be found to the downside. As the saying goes, "all gaps get filled, it's just a matter of when".
At present, market breadth has/is improving from one week to the next. This past week we experienced new highs in certain bullish breadth signals across the board, even from mid- and small-caps.
But of course, for every strengthening breadth indicator, others aren't quite as robust from one week to the next. Take for example the S&P 500 14-day Relative Strength Index (RSI). It did rise WoW, but it was so minute that it barely registers on the chart below:
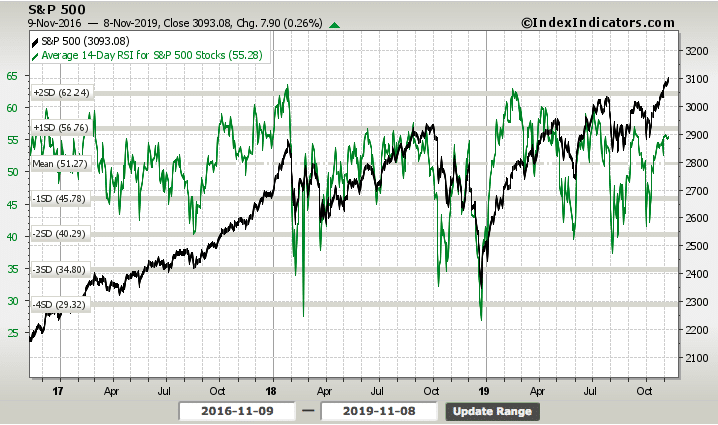
The S&P 500 14-Day RSI rose only .04bps from the prior week, even as the S&P 500 itself rose nearly .9% on the week. Additionally, what we can conclude from the RSI chart is that previous peaks in the market came with higher RSI readings. As such, maybe there is still yet some room for the S&P 500 to run. Maybe it will find that 3,100 level it is seeking. In the context of level-seeking behavior, recall what I wrote in our last Research Report of 2018 about algorithms:
"Finom Group has been stating for some time now, that the mechanical/technical/quant/algorithmic correction has taken hold of the marketplace. It continuously seeks out and finds most every important S&P 500 (SPX) level on a weekly basis, bringing about a bear market condition in many sectors such as the financials and many of the FANG stocks to boot."
Algorithms will likely only prove an increasing component of market trading for years to come. While they served to exacerbate the technical bear market in Q4 2018, they are likely have the opposite impact on markets in Q4 2019. With that in mind, we also key in on some other levels and price targets. In early November, the bulls have had the upper hand, and it’s clear that most investors have not expected the stock market to be as strong as it has been, but with another 7 weeks left in the trading year, there is plenty of time for bears to make an impact. Especially in the coming week. Below are the price targets of many key firms/analysts for the year-end 2019.
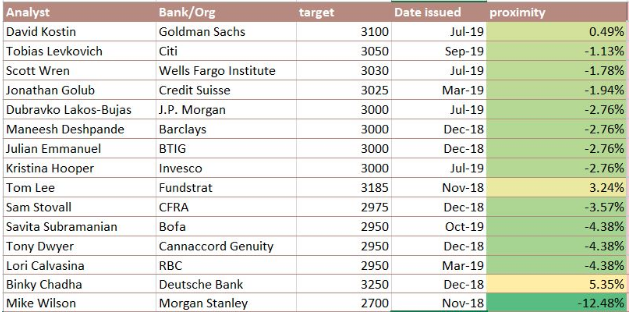
With more than half of the year-end price targets already achieved at 2,950-3,050, market breadth is going to be appreciated that much more by investors. With the noted table of firms/analysts' targets above, I remind and reiterate for readers and Finom Group members (for who I am employed), our 12-month S&P 500 price target that was issued on June 30, 2019.
"Taken as a whole, Finom Group has analyzed all of the economic data and juxtaposed it with the average analysts’ estimate for FY19 and FY20 S&P 500 EPS to deliver our new 12-month S&P 500 price target. After achieving Finom Group’s previous target of 2,950, we offer a new 12-month price target of 3,120."
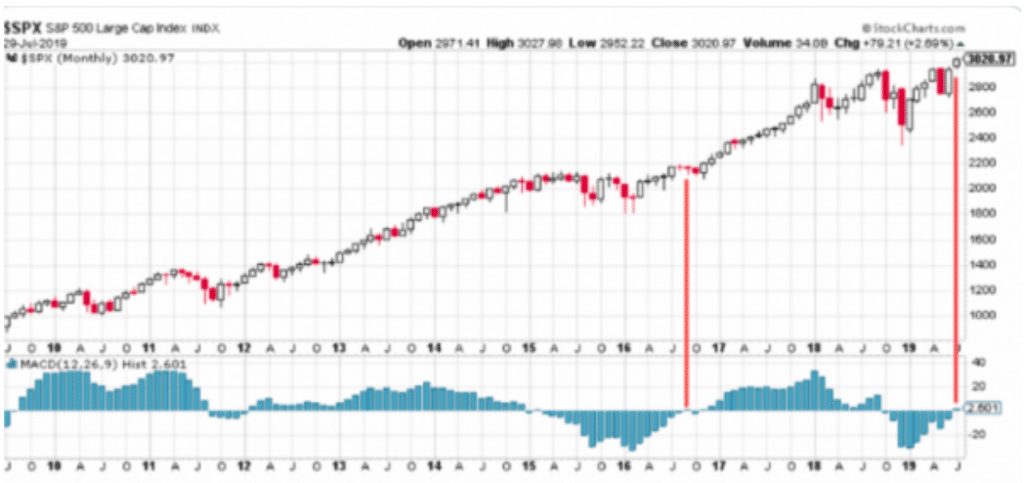
With a 5-week winning streak and a bullish uptrend leading the S&P 500 closer and closer to 3,100, the question will likely be asked amongst the investor community, "How much further can we possibly go, and without a more prominent pullback to boot?" I believe this is why market breadth will become increasingly en vogue amongst traders, not necessarily investors. Investors are likely to ignore intermediate breadth, should it weaken along with the major indices, in favor of a longer-term perspective. And why you might ask? The answer is relatively simple. While weekly breadth can wax and wayne, a more long-term market breadth indicator showed itself profoundly bullish in late July. It was at that time that the Moving Average Convergence Divergence (MACD) turned higher. We must not, can not and should not overlook this major bullish indication that took place back in July of this year.
Moving Average Convergence Divergence (MACD) is a trend-following momentum indicator that shows the relationship between two moving averages of a security’s price. The MACD is calculated by subtracting the 26-period Exponential Moving Average (EMA) from the 12-period EMA. We can see from the chart of the S&P 500 and MACD (on the bottom) where it turned higher in July of this year, depicted below:
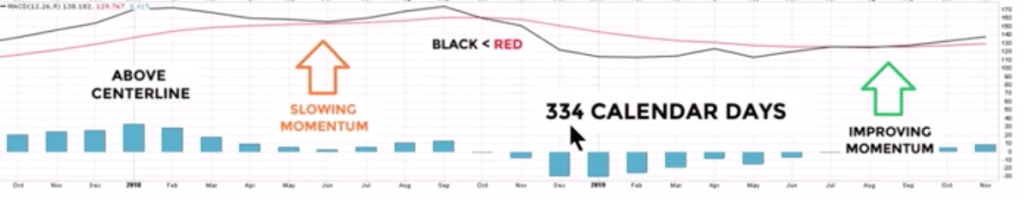
While MACD only slightly turned up in July, it identified a shift in investor sentiment and most importantly, momentum! The MACD first turned lower back in October of 2018 as indicated in the chart below: (charts from Ciovacco Capital)
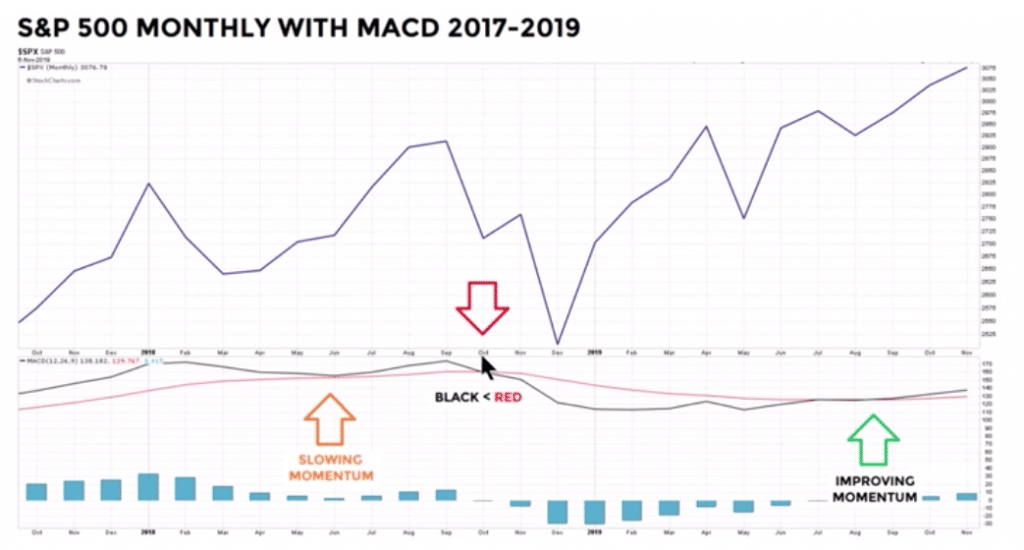
It took MACD roughly 9 months or 334 calendar days before it turned higher once again.
Here is what I discussed back in July and with the MACD's first bullish crossover in roughly 9 months:
"When the MACD turns higher, this is usually a bullish technical sign of things to come for the market, at least based on history."
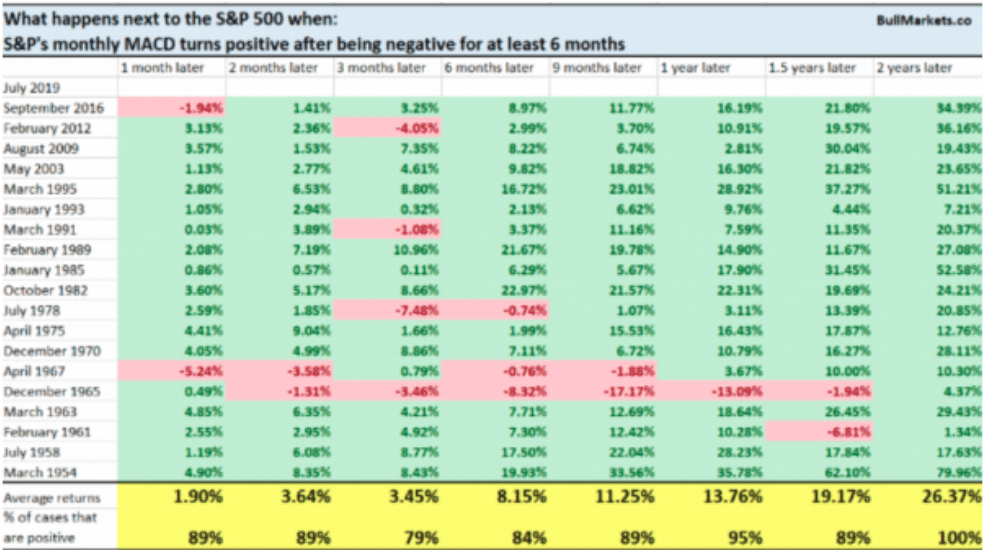
The table above from Troy Bombardia was also included in my report back in July that was titled "Powell, You Got Some Splaining To Do. The table depicted what typically happens next when the S&P 500's MACD turns positive after being negative for at least 6 months. As shown in the table, the S&P 500 is higher by 1.9% roughly 89% of the time following the criterion noted. But history does not always repeat and it did not repeat for the month of August. Recall in August, the S&P 500 lost nearly 2% and logged its worst monthly performance since May, when it dropped 6.6 percent. Fortunately, the month of August has proved the only outlier to-date and since the MACD turned up. To reiterate, the MACD revisitation is with consideration of the longer-term outlook for the S&P 500 and why investors won't be as heavily concerned if breadth and the overall market weakens in the coming weeks. With that being said, a few more breadth/market internal indicators before moving on to something a bit more in focus...
The percentage of stocks trading above their 20-DMA weakened heavily this past trading week, and is easily noticeable in the chart below and unlike our former RSI chart:
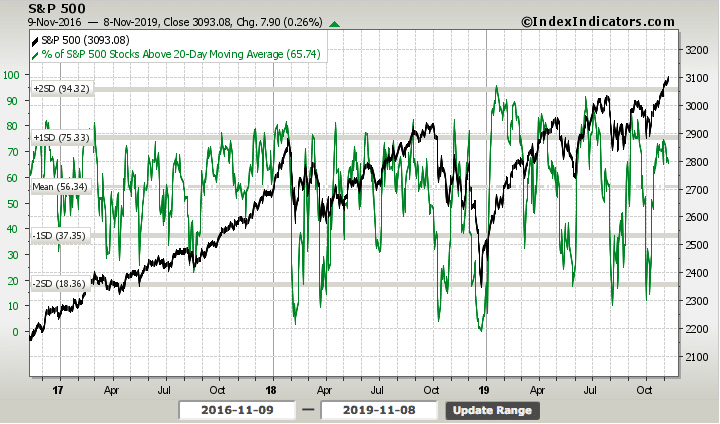
The breadth divergence is clear and something that might be pointing to a near-term top in the coming week. With that, let's take a look at the percentage of stocks trading above their respective 50-DMA.
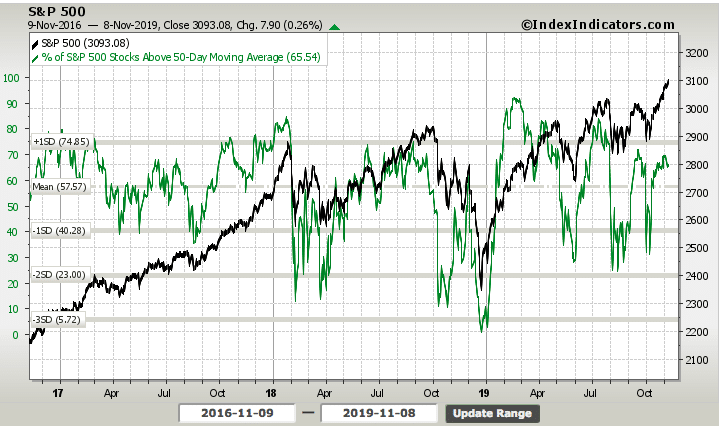
Oh, Houston... Houston, Houston, Houston... it appears we may have a near-term problem ahead. Both the percentage of stocks trading above their 20 and 50-DMA's has weakened with the S&P 500 moving higher this past week, and both are showing negative breadth divergence. Remember, breadth is one of the 2 structural components of the market that drive the price over time. We can't deny that some of the breadth components are proving worrisome. Here is how Andrew Thrasher of Thrasher Analytics describes breadth in the context of what these market internals are presently expressing and why we should pay attention if we are attempting to time a pullback of sorts:
"When the individual components of the market begin to breakdown, the structure becomes threatened. The timeframe for the resulting impact can varying greatly, it’s like playing a game of Jenga. As more pieces are pulled from the base and placed on top, the tower grows but becomes more and more unstable. You can’t know for sure which piece pulled will result in it coming crashing back down to earth, but a casual observer can recognize the instability being forced upon the tower. With each decline in breadth causing a wider spread or divergence relative to the market, the trend becomes threatened just as the Jenga tower becomes less stable."
I think Andrew's verbiage really puts into perspective how breadth affects directional trends in the market place. But here's the problem:
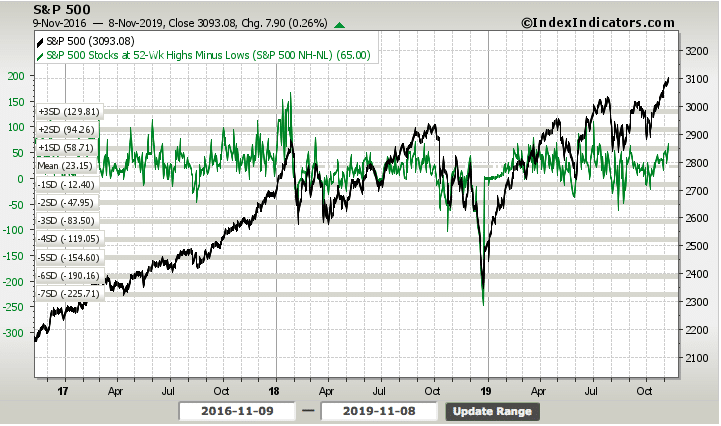
While the former breadth indicators suggest a topping process afoot for the S&P 500, the number of stocks at 52-week highs minus the number of stocks at 52-week lows just rocketed higher this past week. That's the problem with breadth/market internals; there are so many and weighing the importance of one over the other is a foolish exercise that bears little efficacy. As such, we often suggest a focus on the longer-term breadth/market internals and indicators such as the NYSE A/D line and the MACD. "But you guys haven't mentioned MACD in months!" That's the point, it is a longer-term momentum indicator that bears little updating given its duration. As such, the only reason we are giving rise to the MACD again is due to other breadth weaknesses that may affect markets near-term and before the market would likely rebound. Know what to do with a market pullback. In this environment, a pullback should be welcomed and utilized for a longer-term opportunity. (Barring exogenous shock to economy)
I am of the opinion that if the market is finally going to top, for the time being, it will take place starting this coming week. Too many of our valued breadth indicators are flashing signs of a temporary topping process. When combined with what appears to be extreme greed in the CNN Fear & Greed Index, a 5-week rally in the S&P 500 may prove too much to extend without a hiccup of sorts.
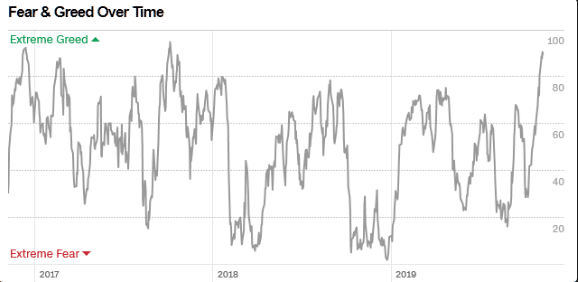
It has been 2 years since we've seen similar levels on the Fear & Greed Index. Having said that, it is useful to remember that markets don't crash when investors/traders are found most fearful, that's usually when a rebound is afoot and as a bottoming process is taking place. Nonetheless, we should also remember that just as we can't predict how long a market can remain oversold, we can't predict how long it can remain with extreme levels of greed and overbought conditions. But that is also why we review market breadth/internals.
Pullbacks should provide an opportunity for investors, given the backdrop of monetary policy around the world that is serving to boost certain areas of the global economy. Secondly and probably equally of importance is the de-escalation of the U.S./China trade war that may find a trade deal of sorts into year-end. Even if it does not result in a deal by then, the fact that no additional tariffs are forecasted for imposition is a tailwind for business sentiment, manufacturing activity, global trade and the overall economy. Given the aforementioned, we anticipate these economic tailwinds to produce tailwinds for earnings growth in 2020. The market follows earnings over time!
In the past trading week, the weekly expected move for the S&P 500 proved once again to be the limitation for the benchmark index weekly rally. The $31/point expected move was tagged at $3,097 and subsequently proved the barrier for further gains.
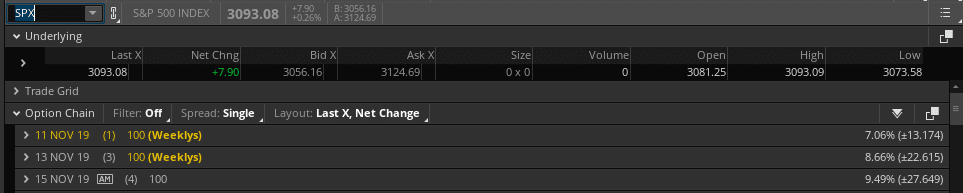
For the trading week ahead, and with the VIX falling roughly 2% for the week, the expected move has moderated lower. The weekly expected move is now roughly $27/points, which assumes little implied volatility for the coming week, but President Donald Trump may have something to say about that.
Weekly Economic Data
It's not going to garner a whole lot of attention if it happens, but come Friday, the latest Cass Freight Index will be reported. The shipping index has been moving higher for 2 consecutive months, even as it has been down YoY and all year long. The index, however, began its nose dive in Q4 of last year, thus, the comparison has all of a sudden become easier and within reach.
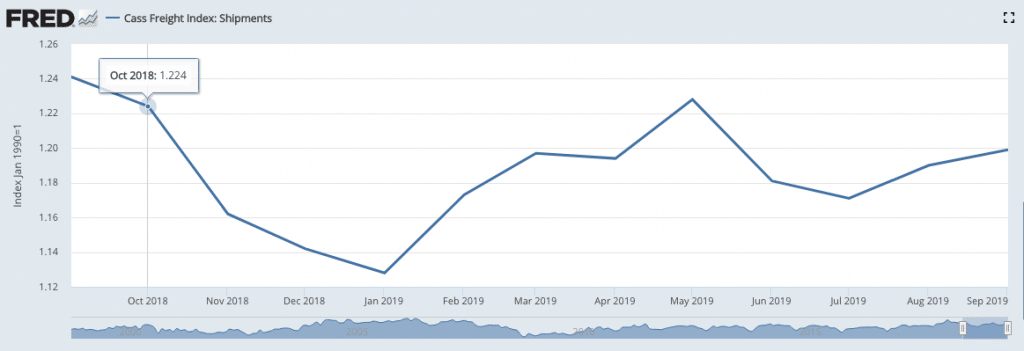
Again, if it is a net positive report, it will likely garner little to no media attention. Simply put, the bearish or negative economic indicators capture more media attention than that which is positive. But keep an eye out for this key indicator of economic transport come Friday.
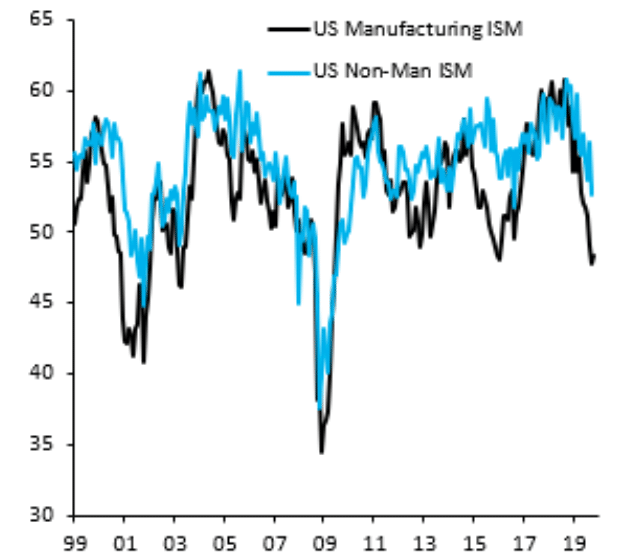
During this past week, investors were widely anticipating the release of the ISM non-manufacturing/services Index. The Institute for Supply Management’s said its non-manufacturing index rose to 54.7% last month from a 52.6% reading in September that was the weakest in three years.
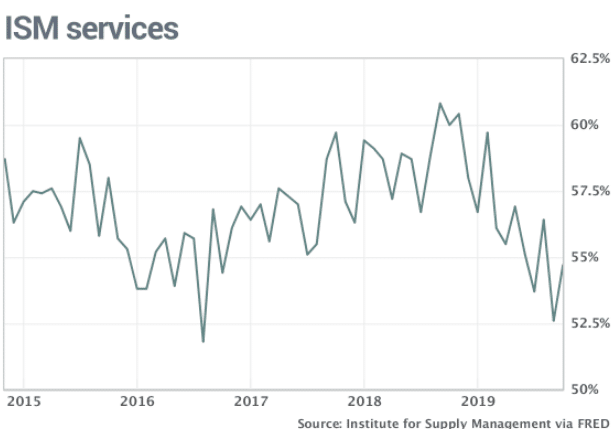
- New orders and employment levels both improved. The index for new orders climbed 1.9 points to 53.7%.
- The employment gauge rose 3.3 points to 53.7% from a five-year low in September. Some executives complained of shortages of skilled labor with the unemployment rate at a 50-year bottom.
- Altogether, 13 of the 17 industries tracked by ISM said their businesses were expanding, the same as in the prior month.
Fortunately, services are the biggest part of the U.S. economy. Even as manufacturing has tilted into contraction territory over the last 2 months, the services sector has held up well and may start a new uptrend, if manufacturing has indeed bottomed, which many believe it has. In fact, much of what we see by way of the respective PMIs in the U.S. can be seen in the German economy as shown in the following charts from Robin Brooks:
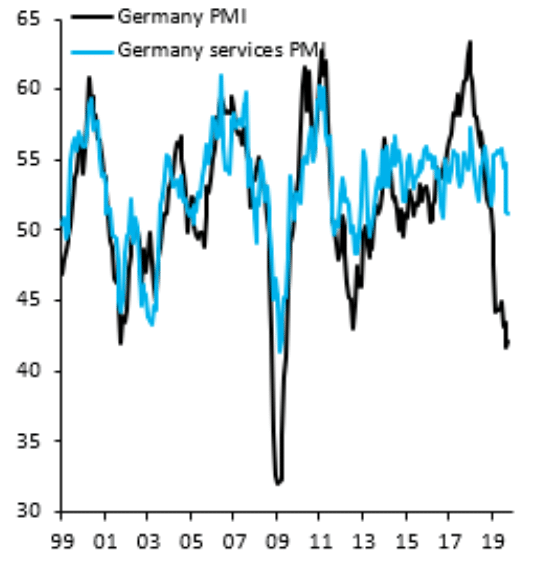
For the past year, we've seen weak manufacturing and, with a lag, services catching down. This may now switch to manufacturing bottoming, perhaps even rising a bit, and services recovering with a lag.
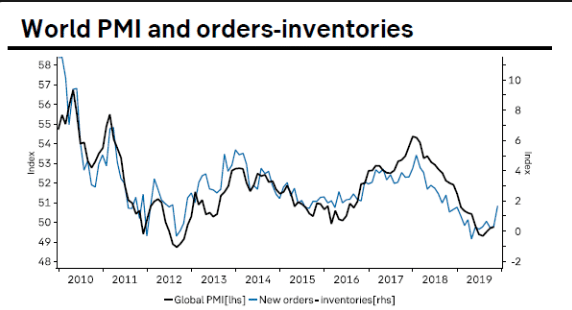
Moreover, I have highlighted that a major factor plaguing global and domestic PMI data over the last 15 months has come as a result of front-loading inventories as a means to avoid increased tariffs. Such front loading largely began ahead of the July 2018 tariffs and persisted as the calendar year turned. The front-loading activity brought about excessive rising in manufacturing activity/PMI/IMS and since then we've seen vendors and retailers work down inventory levels. In other words, 2019 PMIs are simply payback for very elevated PMIs in 2017-2018.
The inventory story I've presented in past reports is close to its endpoint and our leading indicators point to rising PMIs in more places going forward (chart below).
Sentiment plays a major role and U.S. tariffs to be rolled back is a big positive for business sentiment, hence the tailwind I discussed earlier with regards to the economy and corporate earnings.
Another labor and employment report was issued this past week that showed continued strength for the labor market. Although the JOLTS report showed a headline that weakened MoM, it still proved robust in general. In September, job openings fell from 7.301 million to 7.024 million. The good news is the August reading was revised up from 7.051 million. Ultimately, job openings are meaningless if they don’t lead to hirings. That’s why we look at hirings more closely.
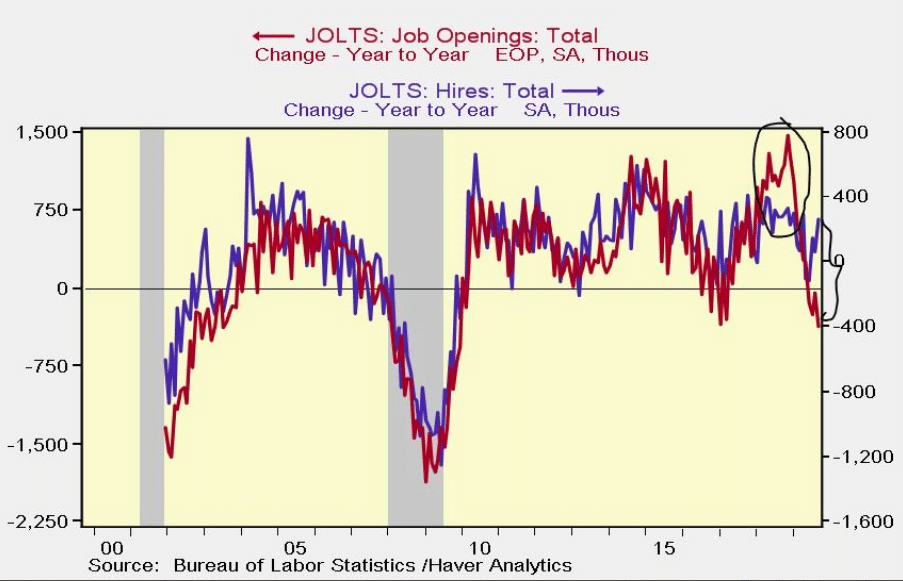
Hirings growth improved 1% from the prior month. Growth is right in line with where it has been most of this economic cycle, outside of a few weak periods during economic slowdowns.
The number of quits was little changed in September at 3.5 million as was the rate at 2.3 percent. The quits level was little changed for total private and for the government. The following graph shows job openings (yellow line), hires (dark blue), Layoff, Discharges and other (red column), and Quits (light blue column) from the JOLTS.
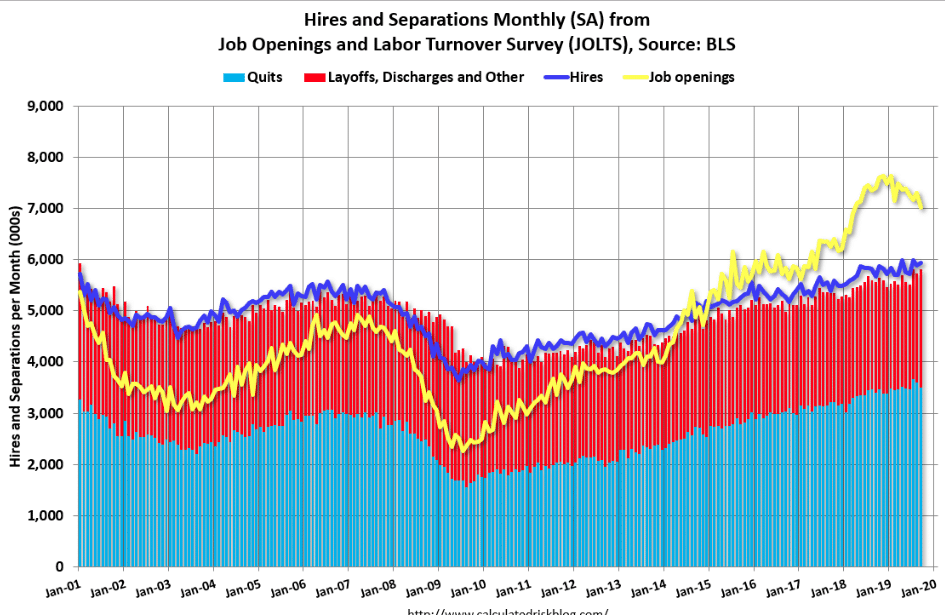
Note that hires (dark blue) and total separations (red and light blue columns stacked) are pretty close each month. This is a measure of labor market turnover. When the blue line is above the two stacked columns, the economy is adding net jobs - when it is below the columns, the economy is losing jobs. Finom Group is of the opinion this was another solid labor and employment report.
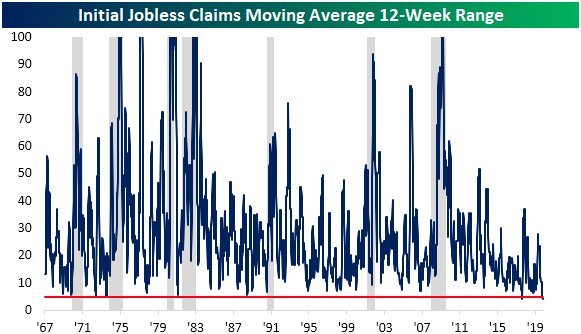
Claims have not done much recently, as they have simply meandered sideways, but remain a sign of economic strength. In the past month alone, the four-week moving average has been in a range between 215K and 216K. As shown in the chart below, the 4-week moving average has been extremely rangebound over the past 3 months. With just 4.25K between the past 12 week’s highest and lowest readings, the moving average has been in the narrowest range since August of 2017 when that range was 4K. (From Bespoke Investment Group)
This past week was gladly a light week for economic data releases. When it was all said and done, most reports proved innocuous if not slightly better than expected, that includes the latest reading from the University of Michigan Consumer sentiment survey. The U.S. consumer sentiment survey rose slightly to 95.7 this month from 95.5 in October, the University of Michigan said Friday in a preliminary estimate.
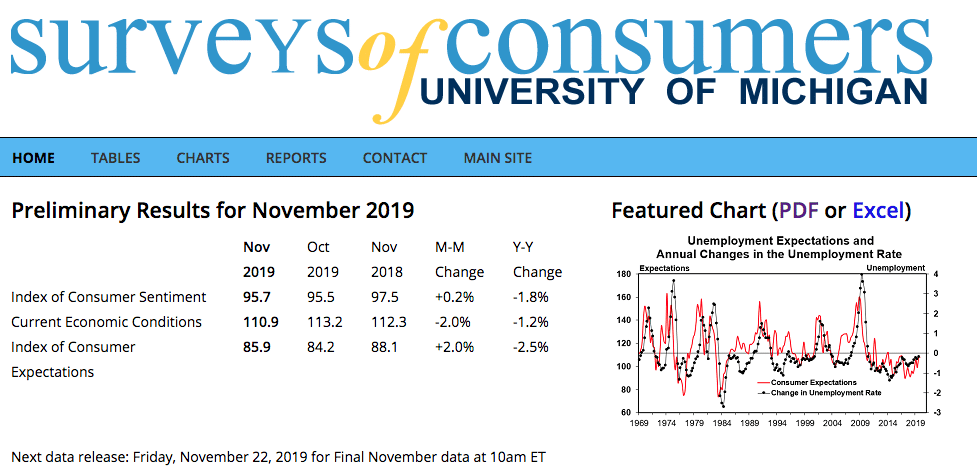
Economists surveyed by MarketWatch had forecast a reading of 95. According to the University of Michigan, a gauge of consumers’ views on current conditions declined to 110.9 in November from 113.2 in October, while a barometer of their expectations rose to 85.9 from 84.2. "We'll take the future is brighter for 100 Alex!"
“Although consumers have become somewhat more cautious spenders, they see no reason to engage in the type of retrenchment that causes recessions,” said Richard Curtin, the surveys of consumers chief economist.
It's becoming clear that the economic data while having weakened through much of 2019, may be entering a period of reaccelerating economic growth. How much re-acceleration will there be remains to be seen and is largely dependent on the future of business investment which is also likely dependent on the trade war outcomes over the coming weeks and months. Even so, we stress that no further tariff impositions is the match to get the fire going. The trade deal itself will simply aid in fanning the flames of the fire going forward. Speaking of going forward, let's now take a look at what lay ahead for economic data releases.
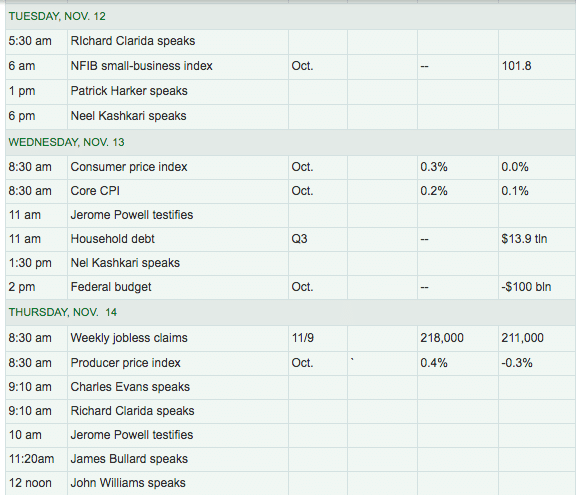
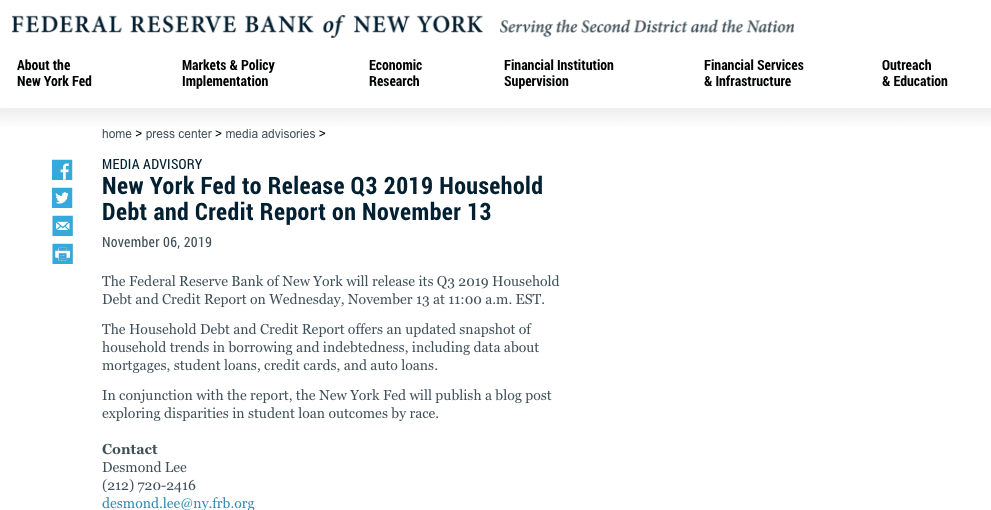
Come Tuesday, investors will get a look at the latest survey for small business sentiment by way of the NFIB. In truth, it's another light calendar week for economic data, but there will be some key deliveries on the periphery such as the Cass Freight Index mentioned earlier as well as N.Y. Fed's quarterly Household Debt report.
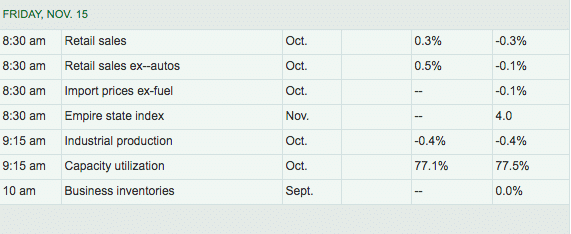
To round out the week, however, monthly retail sales will be highly watched by most investors, economists and analysts. After the typical September drubbing reported, all will be looking for a MoM rebound and with retailers beginning to report results over the next two week period.
With a light economic data calendar ahead, Fed speakers will be abound, as they usually are on a weekly basis. Nonetheless, the most important speech for the coming week will come from none other than the President of the United States of America himself. Some measures of market breadth weakening, S&P 500 setting daily record highs it seems, investor greed at 2-year high readings and an important speech from the President will follow all of this... but of course! And let's not leave Fed Chairman Jerome Powell out of the mix for this coming week's anticipated speeches...
President Trump speaks to the Economic Club of New York during a Tuesday luncheon, and investors are hoping for clarity on a possible trade deal. The Fed chairman speaks Wednesday to the Congressional Joint Economic Committee, and he also appears before the House Budget Committee Thursday.
Year after year, the pessimistic theories on the U.S. economy have been proven wrong. Eventually, the country will fall back into a recession, but I won't be listening to the gurus and pseudo-economists who masquerade as experts that would have had us hiding under the bed for the last 9 years. We'll simply continue to look at the data objectively and weigh the preponderance of evidence on a weekly basis.

As the photograph above might suggest, I believe the U.S. economy remains on sound footing!
Earnings Outlook
As I've mentioned each passing week, I anticipate positive revisions from both FactSet and Refinitiv with regards to Q3 EPS forecasts. Recall that at the onset of earnings season, FactSet was forecasting a decline of S&P 500 EPS on a YoY basis of -4.7 percent. If the beat rate holds constant through earnings season, the actual EPS decline will only be -.5% YoY. A decline is still a decline, but it is far from the earnings recession witnessed from Q4 2015 through Q2 2016 (double-digit EPS decline). So let’s take a look at the latest EPS outlook for the Q3 earnings cycle from FactSet.
- Earnings Scorecard: For Q3 2019 (with 89% of the companies in the S&P 500 reporting actual results), 75% of S&P 500 companies have reported a positive EPS surprise and 60% of S&P 500 companies have reported a positive revenue surprise.
- Earnings Growth: For Q3 2019, the blended earnings decline for the S&P 500 is -2.4%. This is an improvement from the prior forecast of -2.7%.
- The blended revenue growth rate for the third quarter is 3.2%, which is above the revenue growth rate of 3.1% last week.
Insight/2019/11.2019/11.08.2019_EI/S&P%20500%20Earnings%20Growth.png?width=920&name=S&P%20500%20Earnings%20Growth.png)
- The forward 12-month P/E ratio is 17.4, which is above the 5-year average and above the 10-year average.
- During the upcoming week, 15 S&P 500 companies (including 2 Dow 30 components) are scheduled to report results for the third quarter.
- For Q4 2019, analysts are projecting a decline in earnings of -1.1% and revenue growth of 2.6%. For CY 2019, analysts are projecting earnings growth of 0.1% and revenue growth of 4.0%.
- For Q1 2020, analysts are projecting earnings growth of 5.3% and revenue growth of 4.5%.
- For Q2 2020, analysts are projecting earnings growth of 6.6% and revenue growth of 5.0%.
- For CY 2020, analysts are projecting earnings growth of 9.7% and revenue growth of 5.4%.
It is important to appreciate that only a few months ago, EPS estimates for FY2020 were calling for 8-10% growth. While it may seem as if EPS estimates being lowered for the coming year are a negative for the S&P 500, the reality is that it sets the stage for positive surprises, as lowered estimates tend to breed easier beats.
With FactSet's Q3 EPS expectations revised higher for both earnings and revenue growth, now let's take a look at Refinitiv's outlook and/or revisions.
Aggregate Estimates and Revisions
- Third quarter earnings are expected to decrease -0.5% from 18Q3. Excluding the energy sector, the earnings growth estimate is 2.1%.
- Of the 446 companies in the S&P 500 that have reported earnings to date for 19Q3, 74.2% have reported earnings above analyst expectations. This compares to a long-term average of 65% and prior four-quarter average of 74%.
- 19Q3 revenue is expected to increase 3.9% from 18Q3. Excluding the energy sector, the growth estimate is 5.3%.
As we can see in Refinitiv's revised outlook, they have also positively revised their outlook on EPS growth of -.8% to -.5% this past week. It's also becoming increasingly relevant to focus more closely on the noting of energy sector impact to EPS growth: "Excluding the energy sector, the earnings growth estimate is 2.1%."
As the price of crude oil goes, so goes the energy sector and the price of crude has proven incredibly resilient of late, despite lowered demand forecast for the black gold by the EIA. From mid-November through mid-December of 2018, the price per barrel average just above $53.
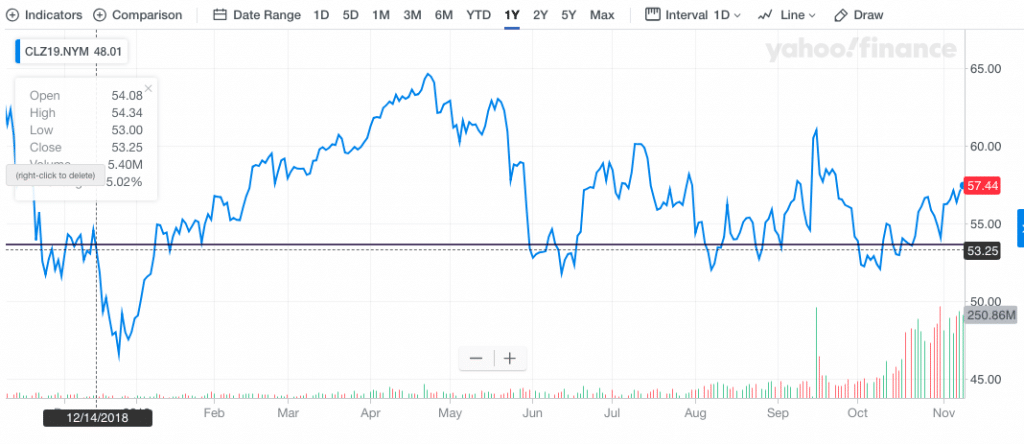
As we can see from the 1-year price of crude in the chart above, past mid-December, the price of crude took a nose-dive. At present, the price of crude is above the point of the noted time frames from last year and could prove a tailwind for energy sector EPS in Q4 if it just remains in the mid-$50s. We don't believe this has been more carefully represented in S&P 500 Q4 EPS forecasts to-date and could prove to provide upside potential for the energy sector through year-end, at least.
For the week to come, probably the most anticipated earnings reports will come later in the week.
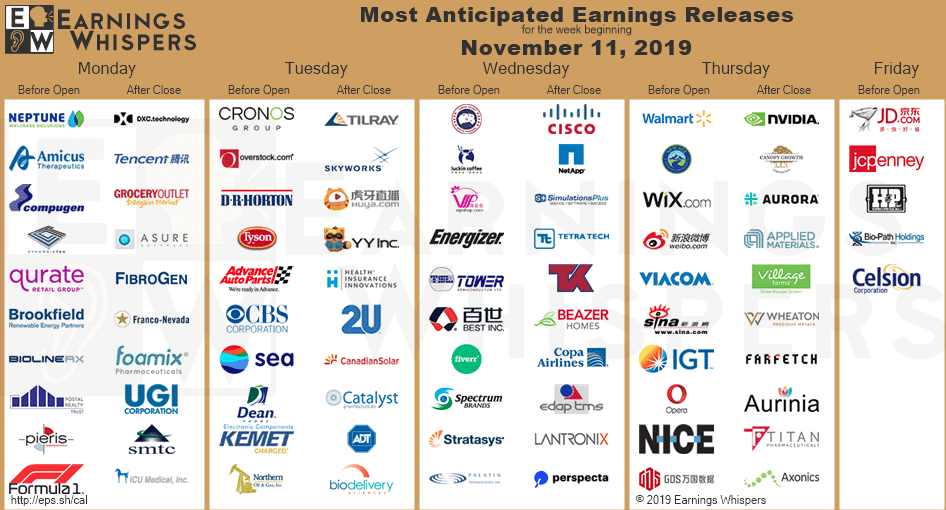
Remember, the next couple of weeks are the culmination of earnings season, which means retailers will be reporting Q3 results. Wal-Mart (WMT) will be out with its results ahead of the opening bell on Thursday, the day before monthly retail sales are released. Nvidia (NVDA) will report after the close on Thursday. Then, the beleaguered J.C. Penney (JCP) will round out the week, as traders are hoping for the bottoming of results from the retailer and a brighter future ahead. Since JCP shares found a low price of $.53 a share, the stock has steadily climbed to above $1 per share but hasn't moved much from that point, as insiders have been selling stock and earnings results are anticipated. It's going to be a very difficult holiday retail season this year, as it has been since the expansion cycle began a new in 2009. This year, retailers have 6 fewer holiday shopping days, as Thanksgiving falls a week later than it came in 2018. Shipping wars will also plague the bottom line of retailers, with Amazon increasingly lowering the price for Prime members and rolling out 1-day shipping nationwide.
Volatility Update
For a second week in a row, Non-commercials took their net shorts to yet another record level, as the S&P 500 did so in kind.
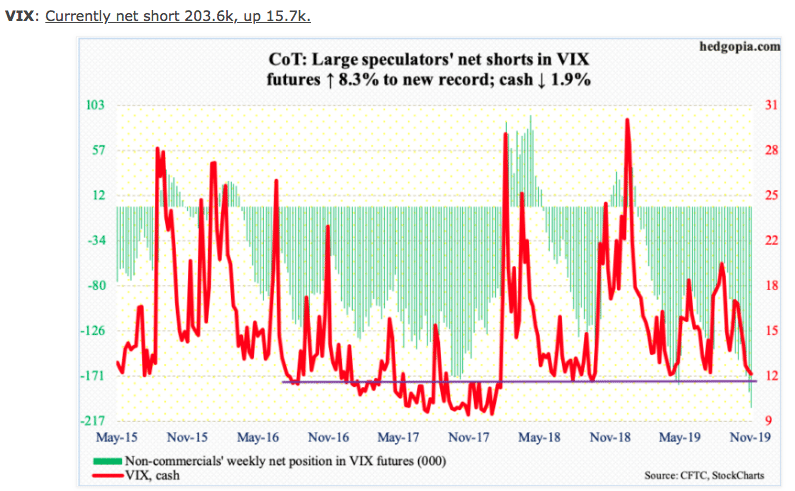
In terms of the total Volatility complex positioning, nothing has really changed materially from last week's outline. What we are more clearly able to recognize is that while Non-commercials are increasing their net short Futures positions, Commercials are increasing their longs, which is showing up in VIX Futures term structure. Let's show you what I'm talking about...
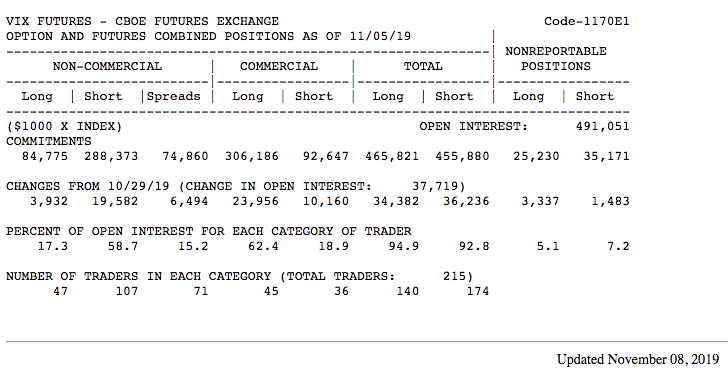
From the COT Futures table above, reported as of November 8th, we can see the increase in short and long Futures positions compared to the previous week (See Research Report). The rows and columns are easily discernible from Non-Commerical, Commercial, Total and Non-reportable. All we really care about are the first couple of rows and columns underneath to extrapolate value. It's a fancy way to suggest one starts reading the columns at the top and work your way down in columns for each row.
- Example from COT table: Non-commercial's increased VIX shorts by 15,650 contracts. From line two (Change from 10/29/19) simply subtract the short (19,582 - 3,932=15650) from the long contracts. If we do the same for the Commercials we take 23,956 - 10,160 = 13,796. The difference between the short and long Futures positioning across the total complex is just 1,854 net short Futures, which oddly enough is the average calendar day contract sales from individual VIX-ETPs. In other words, most of the short increase is being buffered with long exposure by the Commercial interest. It's why VIX Term Structure is still carrying a rather unusually robust spread/roll yield.
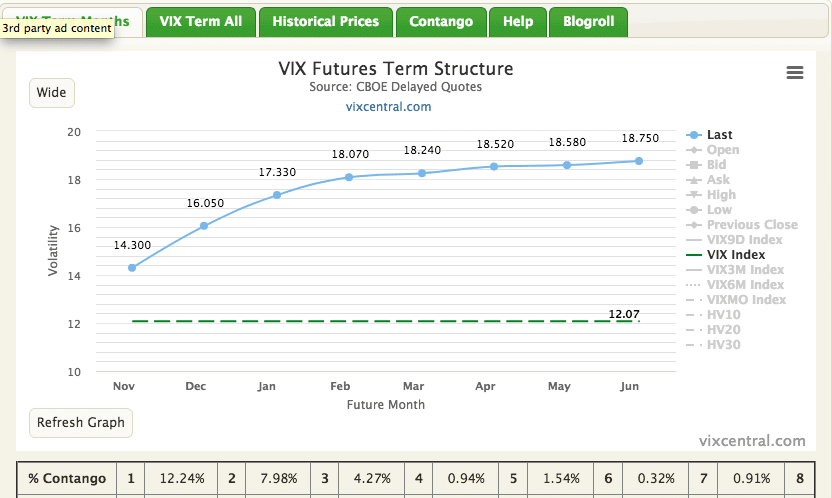
From the November/M1 Futures contract to spot VIX, there remains a greater than $2 spread/roll yield. For context, we would usually expect to see less than $1 roll yield with only 8 calendar days left in the November contract come Monday. The current price of the November contract suggest those long are not found believing that over the next 8 days, the VIX will remain at such low levels of the year. It's a risky bet given the expiration date, but it doesn't exonerate the probability of VIX moderating higher. Additionally, and in the context of roll yield, there is presently a near $4 roll yield between the December contracts and spot VIX. Again, investors clearly believe the VIX will moderate-higher in the future.
None of the aforementioned suggests the VIX will stay at these low levels or move higher. What I suggest is that the fear over the Non-commercial record short interest is nothing that has the ability to express what happened during Volmaggedon in 2018. More importantly, what I would suggest from VIX Futures Term Structure is that if/when the VIX rises and should VIX-ETPs rise in tandem, layered duration short positions remain the optimal participation. The slope of the curve is quite steep and seasonality proves favorable for market conditions post any relevant rise in market volatility.
Investor Takeaways
You can't profit from a robust market uptrend without exposure to that market uptrend. To the extent the market has delivered a greater than 23% return year-to-date, most investors have been content to sit on the sidelines and watch the rally pass them by.
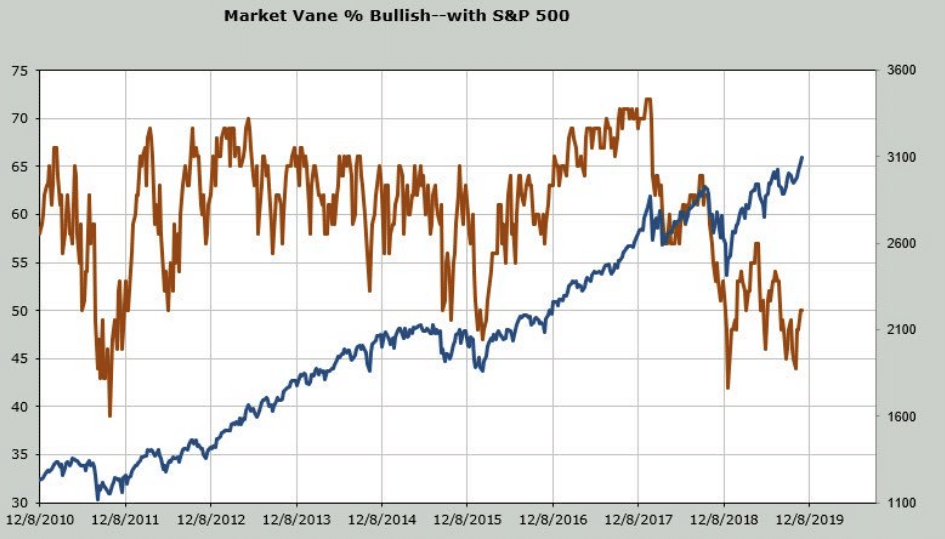
Investors still dislike stocks and remain cautious with their allocations. They still don’t believe in the rally. Light positioning has created a liquidity vacuum in the market that which has worked in the opposite direction of the liquidity vacuum from this time a year ago.
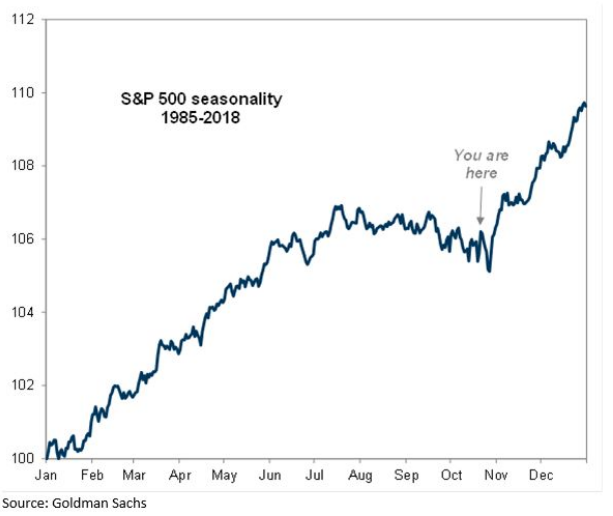
Positive long-term, bullish signals are abound in the marketplace regardless of the fearful headlines, modest market breadth weakening and extreme sentiment issues. One of the less discussed positives that occurred just his past week in the market happened via the Dow. Another Dow Theory BUY signal (one of many in this Secular Bull market) was generated this week when the Dow Industrials and Transports both made new highs. While we should expect pullbacks here and there during the bull market cycle, anyone that dismisses this signal may be making a mistake of sorts. And if you think the market rally is going to end the year without the Russell 2000 (RUT) catching a new high, that may be the outlier view, given the chart below:
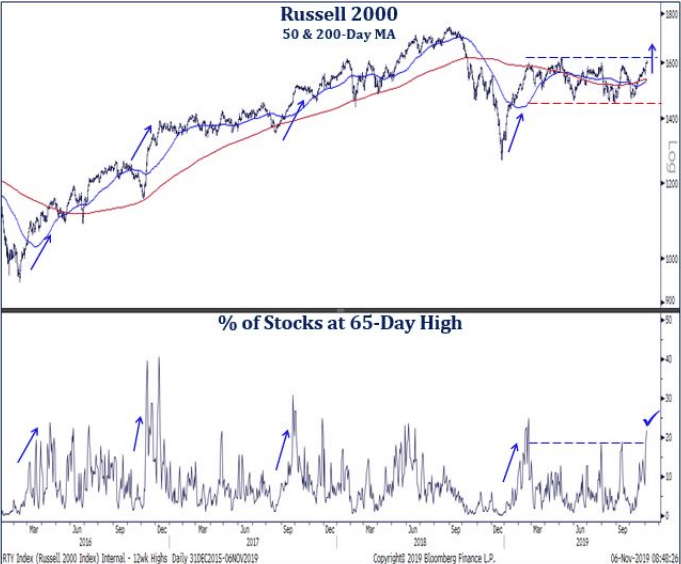
Small-caps are on the verge of breaking out from a 9-month range with new high data the strongest since the rally off the December lows.
No new tariffs! The existing tariffs that are in place and that have proven a YoY headwind for economic and EPS growth in 2019 are will simply be the normal as the calendar year turns a New Year. No new tariffs is the key variable for the global economy and markets going forward. Anything above and beyond this, like tariff rollbacks is a tailwind.
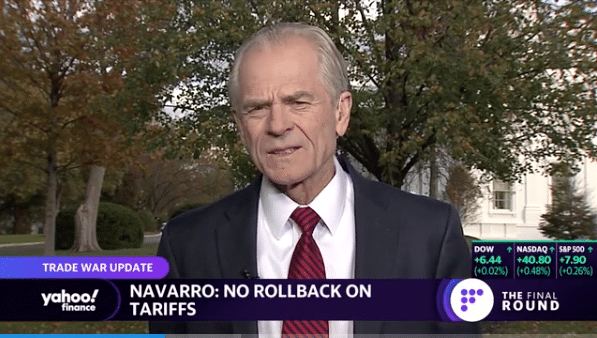
Every impetus and reason to complete a phase 1 trade deal is available and found with conviction by both the U.S. and China. The notion of rolling back tariffs, despite media and White House officials usage of "word play", we believe is the path toward a phase 1 trade deal. It has been reported by U.S. trade representative Peter Navarro that tariffs that tariffs will not be rolled back.
“There's no rollback at all,” Navarro said. “So we need the tariffs there, but the tariffs are really our best insurance policy as well to make sure that the Chinese are negotiating in good faith.”
While Navarro has decided to throw cold water on the idea of tariffs being rolled back, I understand the rationale behind this negating commentary. The media grabbed the Thursday headlines that suggested the U.S. and China had agreed to this rollback condition as part of a phase 1 trade deal, but a deal does not yet exist, no signatures. Given this point of fact, the U.S. trade officials simply desire to keep an upper-hand of sorts in the ongoing negotiations, tempering public expectations as well. Nonetheless, we are also of the opinion that the reality of a deal is to come with tariff rollbacks, as confirmed by a more trusted White House advisor, Larry Kudlow.
On Thursday, Kudlow confirmed the Chinese Commerce Ministry’s claim of a tariff accord, telling Bloomberg News: “If there’s a Phase 1 trade deal, there are going to be tariff agreements and concessions.”
It was only after this confirmation, which is something no White House official had offered in the past, that the naysaying was marched out. If the consideration of tariffs being repealed was not in play, the President would have never agreed to allowing Kudlow to publicly confirm the subject matter. Knowing sentiment was boosted around a trade deal on Thursday, the President attempted to water-down the headline with careful verbiage, so as not to completely negate the rollback narrative.
“I haven’t agreed to anything,” Trump told reporters. “China would like to get somewhat of a rollback, not a complete rollback because they know I won’t do it.”
Once the rollback confirmation was out there in the public, the White House simply second guessed themselves over announcing this material development, not the development itself. In dissecting the rollback commentary from the President and even Navarro it is really a simple exercise in word play and amplification of the words agreed or agreement. Why? No agreement exists yet. We could literally substitute any subject matter into the conversation on what has or hasn't been agreed to because there is no agreement to-date. There are only negotiations that lead toward an agreement.
- I haven't agreed to anything.
- I haven't agreed to where the trade deal would be signed.
- I haven't agreed to meeting President Xi.
- I haven't agreed to adopting a Panda.
- I haven't agreed to the chicken or the fish at Mira Lago.
The President and Navarro weren't lying when they said rollbacks have not been agreed to, as logically no agreement currently exists. Where there is no agreement there are still just ongoing negotiations and, therefore, inserting the word agreed or agreement into any Q&A from the press is satisfactory and offers the White House continued flexibility. Nothing has been signed, therefore nothing has been agreed to and/or is imposed/enforceable until something is signed. When a phase 1 trade deal/agreement becomes signed the White House can then say, "We did agree to...!"
Investors have a choice. They can either comprehend the facts that surround the trade issue, or latch on to the rhetoric that has been commonplace for almost 2 years, which has not born out the worst fears imagined in headlines and proliferated by economists. Then, compare all of that to where the S&P 500 closed on Friday. After that, ask yourself if you're really aligning your investing decisions with facts or rhetoric.
It's the final week for hedge fund redemptions folks. It's one of the main reasons there is often a brief dip in markets into the final 8 weeks of the calendar year.
In 2018, the redemption period acted to exacerbate already illiquid markets, as hedge fund redemptions soared. Leading up to this time period late last year, hedge fund investors were growing increasingly nervous, and rushed to redeem $15 billion from the markets in September, the largest single monthly outflow in years for that period.
For the hedge fund industry, November 15th is their so-called industry D-Day. It marks the deadline for investors to put managers on notice to get some, or all, of their money at year-end. Investors can cash out of most hedge funds quarterly after giving 45 days notice. Withdrawal schedules can vary, as do notice periods. Firms can also levy penalties on clients who want to bail outside of agreed schedules, while investors can cancel redemption plans if they change their minds.
The good news for 2019 is that the market is materially outperforming on a YoY basis and I don't anticipate the same withdrawals as we witnessed in 2018 from the hedge fund industry. Nonetheless, positioning as light as it is and liquidity remaining quite low, any withdrawals from the industry will only provide a tailwind to fund outflows in the event the market does express a drawdown this coming week.
Comments
Log in or sign up to join the conversation.